Evolve IT Metrics JCL/Application Program
Dashboard Metrics
After completing this document, you should have a basic understanding of the CM EvolveIT Dashboard Metrix and the different views available.
1. Log in to the dashboard with a valid dashboard user id.
There is a built-in administrator that can be used for setup initially.
Built-in administrator (Default Password is ‘admin@1234!’)
Once logged in the dashboard view will display.
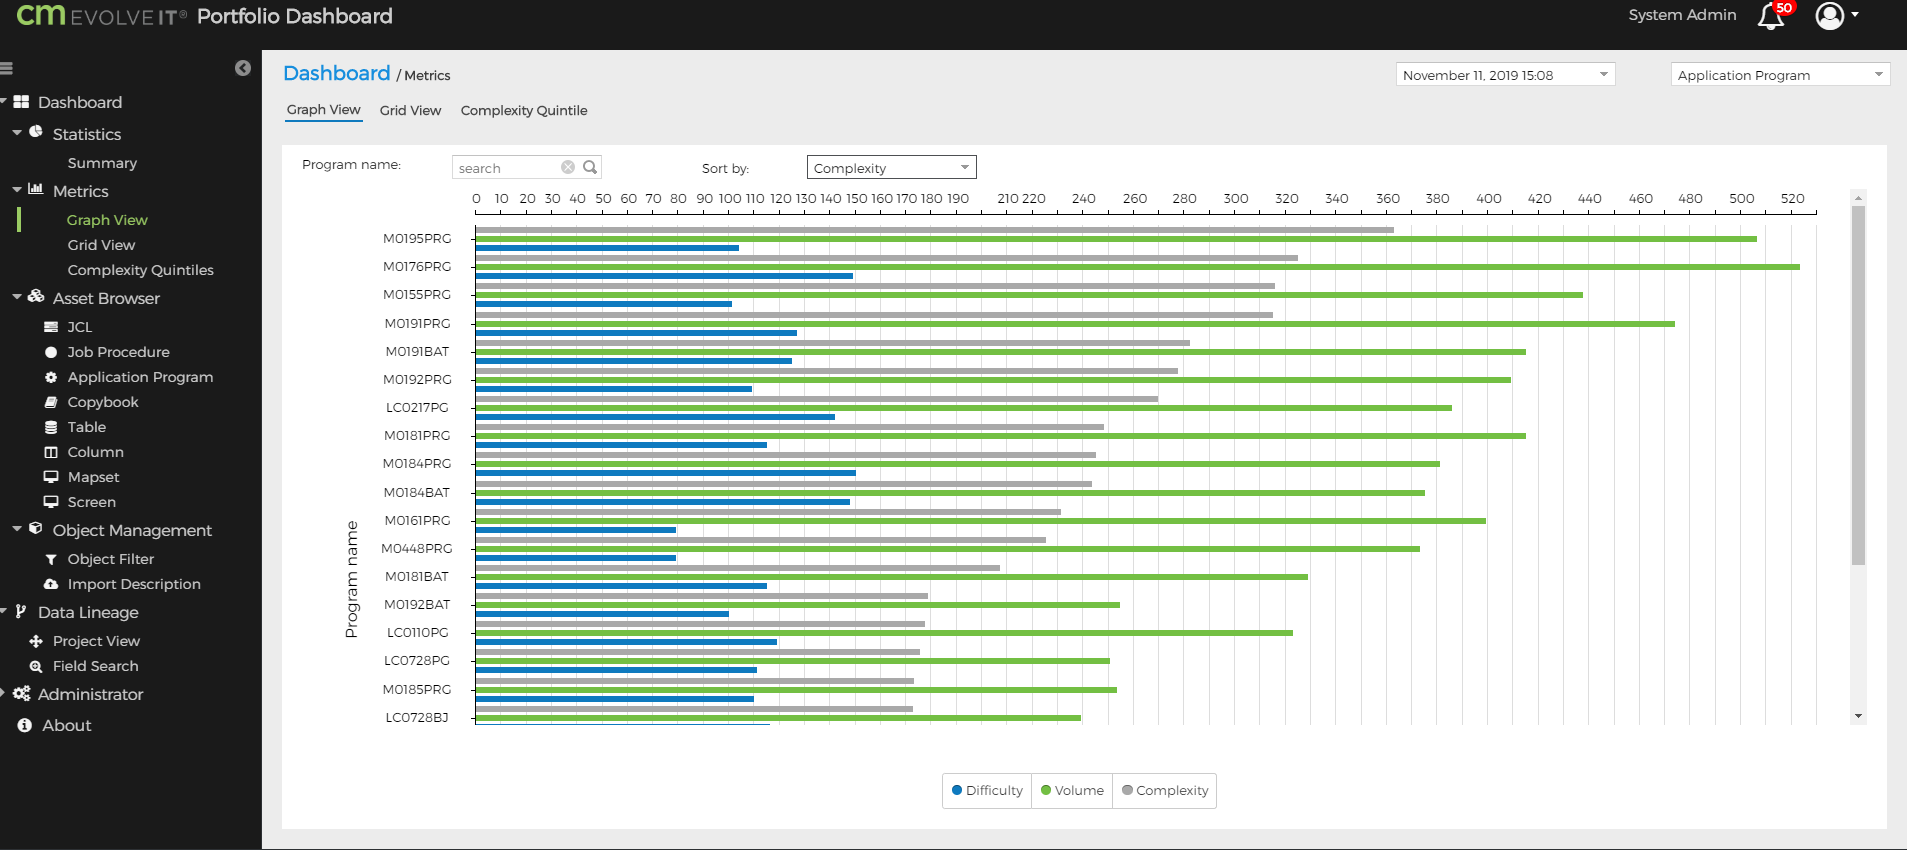
2. Metrics Graph View.
Select Dashboard -> Metrics -> Graph View
Select Application Program in the Dropdown
A graph of the top 25 Application Programs display, Sorted by Property.
Application Program Results
JCL Result
3. Custom Actions
Cange sorting property
Sort by Difficulty.
Sort by Complexity.
Sort by Volume.
Show or hide properties from the graph.
Changing the snapshot date to view the historical data.
Displaying based Difficulty and Volume
Displaying based Difficulty
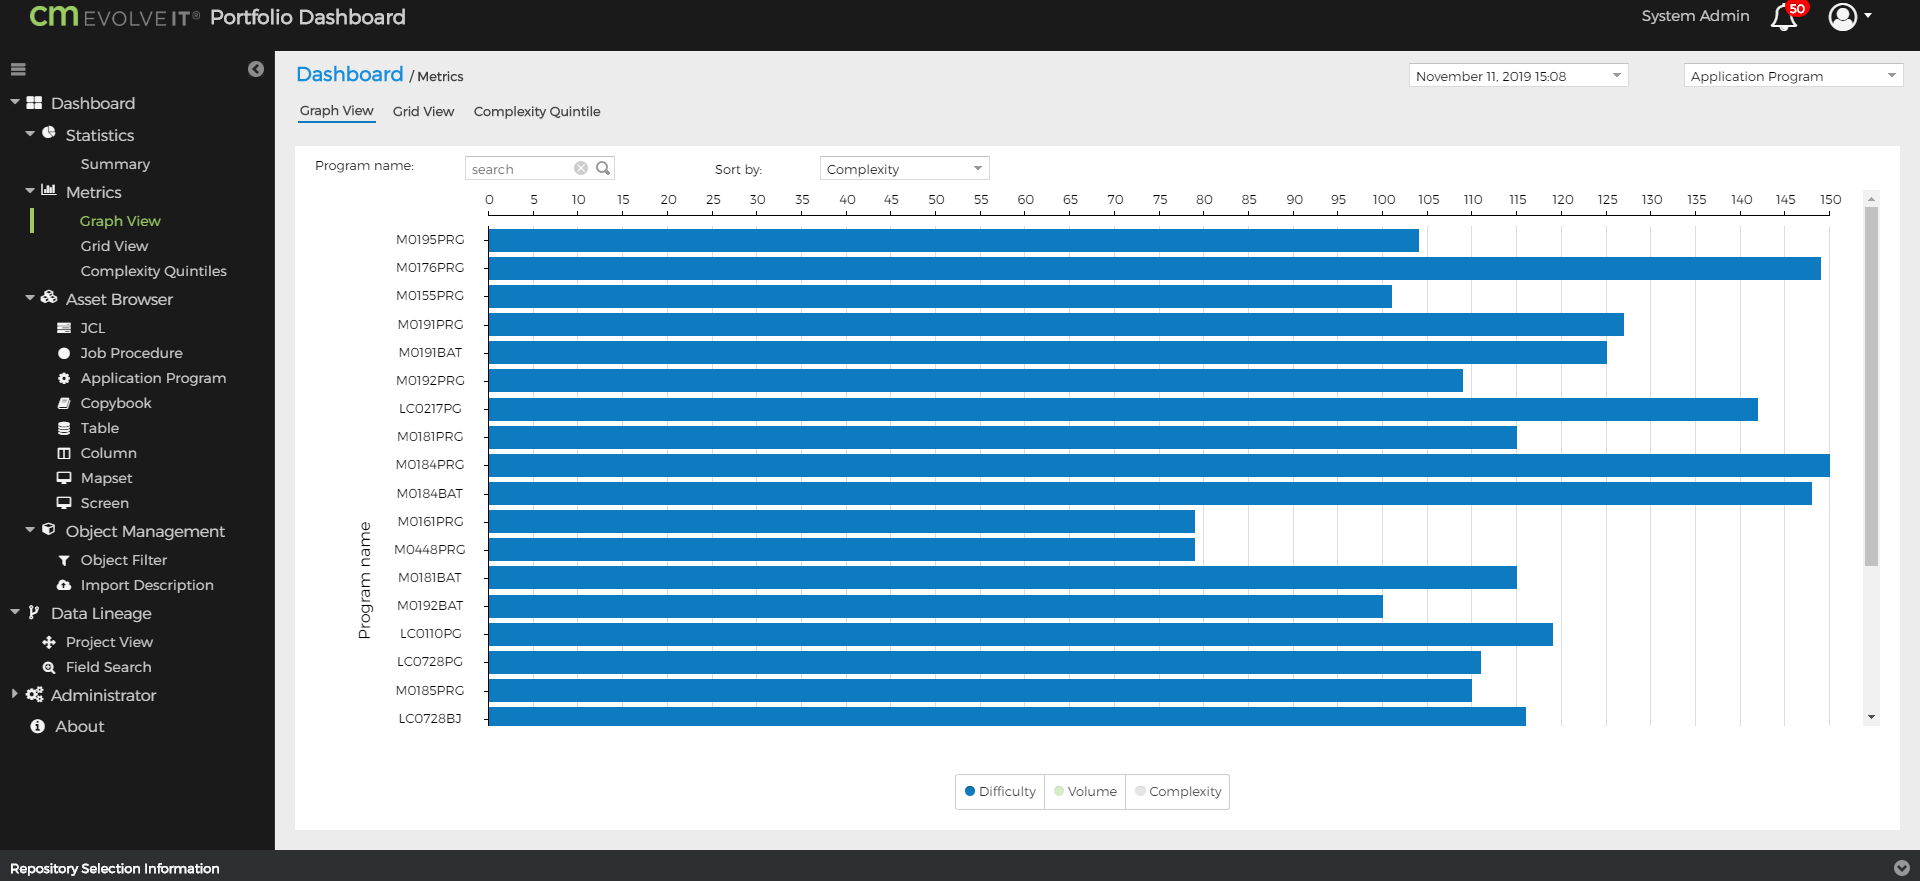
Sorting by Complexity
4. Metrics Grid View.
Dashboard-> Metrics -> Grid View
Grid view displays all the application program/ JCL in a tabular form. Similar Sorting options are available
Sorting by Volume - Application Program
Sorting by JCLProc Count - JCL.
5. Add or remove columns from the grid view.
Click on the down arrow on any column and a drop-down menu will appear with a list of columns checked.
Uncheck any column you wish to remove from the view.
JCL Screen
Application Program
6. Complexity Quintiles View
Select Menu options: Dashboard-> Metrics -> Complexity Quintiles
The Complexity Quintiles graph will appear.
Hover over the graph to get the value range.
Related Articles
Dashboard Metrics JCL View
This document will cover the basics of the CM evolveIT Dashboard Metrix. There will be a discussion of the different JCL views available in the dashboard metrics. After completing this document, you should have a basic understanding of the CM ...Dashboard Metrics Application View
This document will cover the basics of the CM evolveIT Dashboard Metrix. There will be a discussion of the different views available in the dashboard metrics. After completing this document, you should have a basic understanding of the CM evolveIT ...Source Scanner for IBM JCL
This document describes the entities and relations the JCL Scanner creates on encountering various JCL code constructs. Current output Structures Jobs Procedures (cataloged and in-stream) JobSteps(EXEC) Properties File-levelmetrics Procedure default ...Evolve IT Asset Browser
This document will cover the basics of the CM EvolveIT Dashboard Asset Browser. There will be a discussion of the different options available in the dashboard Asset Browser. After completing this document, you should have a basic understanding of ...Running JCL Scanner by Hand
Running the MetaAnalytics CAScanner for JCL by hand. Document Version 0.2 Semantic Designs, Inc. August 2014 [0] Introduction This document describes a manual procedure for running the MetaAnalytics JCL CAScanner tool. This procedure scanner supports ...