CM evolveIT User Manual
Welcome to CM evolveIT
|
User Training
Manual |
Restrictive Rights
This document and the product referenced in it are subject to the terms and conditions of the user License Agreement with CM
First Technologies. All rights are reserved and restricted to the License Agreement.
Copyrights
All rights reserved under Copyright laws of
the
United States.
No part of this publication may be
reproduced stored in a retrieval system or transmitted in any form or by any means, electronic, mechanical, photocopying, recording, scanning or otherwise, except as permitted under Sections 107 or 108 of
the 1976 United States Copyright Act, without the written permission of CM
First Technologies.
1. Your CM
evolveIT Environment
Upon
completion of section 1, students should:
· understand how CM evolveIT works in their
client/server environment
· understand how CM evolveIT contiguous
licensing works
· know the names of their CM evolveIT
administrators
· know their personal CM evolveIT user ID and
password
· have a general, high-level understanding of
the CM evolveIT automated discovery process
· have a general, high-level understanding of
how CM evolveIT automated discovery is implemented and conducted in their
environment
Topics
1.
How client/server
functions together
2.
Concurrent
(Floating) Licensing
3.
CM evolveIT
Administration
4.
Automated
Discovery
5.
Release
Management
1.1 How client/server
functions together
The
CM evolveIT toolset is a client - server application and is made up of 5
separate components. Each of these components serves a specific purpose
for either the administration of CM evolveIT or the analysis
functionality. We will provide a short description of each of these, but for a more extensive explanation please refer to the CM evolveIT Administrator
Training Manual. The CM evolveIT components are:
The Discovery
Workbench provides the capability to parse all of the source code assets to
create the initial database repository and refresh assets as they change.
This component runs on the CM evolveIT server.
The Administrators
Workbench provides the CM evolveIT administrator with the capability to
manage product licenses, add/modify/remove client user names and passwords,
install/cross-reference/remove source code inventories, and view shared memory
information. This component runs on the CM
evolveIT server.
The Server
Manager is a client tool that allows remote administration of licenses and
the ability to start, stop and restart the CM evolveIT server component.
This component can only run on the Server, but should only be used by the local
CM evolveIT Administrator.
The CM
evolveIT Server Component is the workhorse for the entire CM evolveIT
toolset and provides all of the functionality to communicate requested
documentation and analysis results to the Analyst Workbench client. This
component runs on the server.
The Analyst
Workbench provides the user interface functionality to enable all analysis
and documentation. This user component works in conjunction with the CM
evolveIT Server Component to enable the display and interaction with all
analysis results. This is a client component.
1.2
Concurrent (Floating) Licensing
Concurrent licensing is one of the most
flexible licensing schemes available. This licensing approach enables a
group of users to share the capabilities of a software system while not
requiring each user to have their own licensing. In this licensing model
a license is "in use" when a client is logged in to the server.
What this means to you as a user is that it is possible during periods of high
usage that a license may not be available for you to login. Some
coordination between users is warranted to enable the use of licenses in an
efficient manner. This also means that a user that is not actively using CM
evolveIT should log off to enable others to use the license.
·
User ID and
password information (provide their user IDs and passwords)
Each user is provided a unique user name and
password that allows you to login to the CM evolveIT toolset. We have
provided this location for you to write down your username and password.
User
Name__________________________ Password________________________
1.3
CM evolveIT Administration
Each
CM evolveIT customer assigns a primary and secondary Administrator. The CM
evolveIT Administrators are responsible for managing inventories, adding/modifying/removing
users, adding/updating license information, and providing the location with basic
answers for users on the use of CM evolveIT. The CM evolveIT
Administrators also act as the point of contact for product support issues
reported to CM First Technologies. If you have a problem with the CM
evolveIT product you should contact one of your local CM evolveIT Administrators.
Primary Administrator
_______________________
Contact Information
_________________________
Secondary Administrator
______________________
Contact
Information __________________________
1.4 Automated Discovery
The
Discovery Workbench, as mentioned above, is the component that allows your COBOL
and related system components to be parsed and builds all relationships into a
database repository. This process is handled by your CM evolveIT
administrator. As a user, all you need to know is that the process of
discovery provides you with compiler-like accuracy for the information that you
receive from CM evolveIT. This accuracy enables you to explore your COBOL
application with confidence that the CM evolveIT diagrams, reports and
"smart" Data Search functions provide the system and module
understanding you require to accomplish your projects.
1.5 Release
Management
COBOL
mainframe systems are typically large, complex and undergo change on a regular
basis. As a user you want the most accurate information possible to do
your job. In order to provide this unprecedented kind of accuracy the
inventory for an application can be updated by "Refreshing" only the
changed components when a new release is completed. Each customer has
their own unique requirements to manage these updates. As a user, you
will be informed by your CM evolveIT administrator when a new version of the
inventory is ready for use and what components have been updated. Each
user will be provided with a document that describes how their site will manage
releases and how this information will be communicated.
2. Getting Started with CM evolveIT
Learning
Objectives:
Upon completion of section 2, students should:
·
know how to configure and select their CM evolveIT
client-server connection
·
be able to login to the CM evolveIT client
·
understand the organization and content of CM evolveIT
inventories
·
have a general knowledge of the content and use of
inventory views
·
have a general knowledge of the content and use of CM
evolveIT layouts
Topics
1.
CM
evolveIT Inventories, Views and Layouts
2.
CM
evolveIT Client Login and Server Setup
3.
CM
evolveIT Home Screen
2.1 CM evolveIT
Inventories, Views and Layouts
Before beginning to use CM evolveIT’s powerful analytical and
graphical visualization functionality, it is essential to understand some
fundamental concepts regarding the way the tool can be used to organize and
view your COBOL application assets. We’ll
begin with CM evolveIT Inventories, Views and Layouts and how they relate to
each other.
CM evolveIT
inventories are comprised of all assets in a COBOL legacy system that is either
coded assets or discovered assets. An
example of a coded asset is an application COBOL program. An example of a discovered asset is a
physical file that was identified during the CM evolveIT automated discovery
process through parsing and analysis of the JCL. All of these assets, both coded and
discovered, make up the whole of an CM evolveIT inventory for a COBOL
application. A complete list of all CM
evolveIT inventory assets and their definitions can be found in Appendix C of
this manual.
CM evolveIT
views are subsets of an CM evolveIT inventory.
When an CM evolveIT inventory is created through discovery, a Master
View is created for the inventory which contains all of the inventory’s
assets. However, an CM evolveIT user may
want to focus on a certain subset of an inventory’s assets when conducting
analysis. To do this, CM evolveIT views
can be created that contain only those assets pertinent to the user’s analysis
task, allowing the user to focus in on only the assets of interest.
CM evolveIT
layouts are simply a set of selected assets a user wishes to view and work with
from an CM evolveIT inventory View within the main CM evolveIT Inventory
Viewer. An inventory layout can be
customized to contain any combination of inventory assets available in an CM
evolveIT inventory. These assets can be
arranged however the user desires.
Familiarity with CM evolveIT’s Inventory Viewer will be the focus of
Section 2 of this training.
2.2 Client Login and
Server Set-up
2.3 CM evolveIT Home
Screen
Upon initial login to CM evolveIT, the CM evolveIT Home
Screen will appear. The CM evolveIT Home
screen will remain active as a selectable tab throughout your session in CM
evolveIT.
The CM evolveIT Home screen:
CM evolveIT Welcome Window – Provides valuable web links to CMCM evolveIT web sites and
product information.
2.3.1 Inventory View Management Window
2.3.2 CM evolveIT Welcome Window
This window provides valuable product information as well as
links to CM evolveIT Support website.
2.4 Populating an
initial Layout
2.4.1 Cells
2.4.2 Layout tab
By clicking on the word Layouts,
the window will switch to the layout selection list. From this Layout list the user can choose from previously saved
layouts. After the selection has been
made, click on the Populate
button to fill the Inventory Viewer.
At this stage, selection of assets
from the list will populate your initial layout of inventory assets when CM
evolveIT’s Inventory Viewer opens for the first time.
3. Inventory Viewer
Learning
Objectives:
Upon completion of section 3, students should:
·
understand the organization and content of CM evolveIT
layouts
·
know how to create, change, save and retrieve saved CM
evolveIT layouts
·
know all of the unique inventory asset types
·
be able to select multiple assets within a layout
asset cell
·
understand how CM evolveIT represents the different
asset relationships through highlighting and colorization
·
understand how to navigate to and use the four
Inventory Viewer sidebars
·
understand the functional use of Inventory Views
·
be able to create, add assets to, save, rename and
delete an inventory view
Topics
- CM
evolveIT Inventory Viewer Sidebar used for controlling various CM evolveIT
operations
- Main Panel consisting of inventory asset cells
where the majority of CM evolveIT asset viewing occurs
- Properties
Box which contains information about a selected inventory asset
3.1.1 Populating
an Initial Inventory Layout
Upon initial sign in, the Populate Inventory Viewer Window is displayed. This window will also display whenever a new Inventory Viewer is opened unless the user has
selected a default Layout. The Populate
Inventory Viewer Window is also displayed if a user
closes all of the current Inventory Viewer cells.
3.1.2 Inventory
Viewer Asset Cells
Each asset type selected for an inventory
layout will have its own cell in the Inventory Viewer. Asset types can be added, removed, replaced
and arranged in any way desired to build a customized layout of your
application assets. In this section,
we’ll learn how to update, save, delete and recall Inventory Viewer Layouts
through asset cell and sidebar layout controls.
3.1.3 Asset Cell Layout Controls
Changing a Cell’s Size
The size
of an asset cell can be changed by positioning the mouse pointer over the
separation bars between cells, holding the left-mouse-button and dragging the
line to a new position.
Changing a Cell’s Position in a Layout
An asset
cell’s position can be changed by positioning the mouse pointer over the asset cell’s
header box, holding the left-mouse-button and dragging the entire cell to a new
screen position within the layout and releasing the left-mouse button.
3.1.4 Changing a Cell’s Asset Type
Clicking
on the
button next to the asset
type name in an asset cell will produce a drop-down box from which you can
assign a new asset type to that cell.
This allows quick swapping of asset types from within the asset cell
windows.
3.1.5 Selecting Assets within an Asset Cell
Selecting items within a cell of the Inventory Viewer is a simple
process.
To select a single asset, Left Click on the item to select, LC0135PG, in the cell in which it resides, Application
Program.
3.1.6 Selecting Multiple Assets
To select multiple assets, select the first asset, LC0135PG.
Press and hold
down the Ctrl key on the keyboard. While still holding down the Ctrl key, select asset LC0130PG.
You may
also select another asset by using the Shift
key to select all assets between the first and the second selected assets. While holding down the Shift key, select LC0135PG. Assets LC0130PG, LC0131PG and LC0135PG are
now selected.
NOTE: You may only select
multiple items from within the same cell.
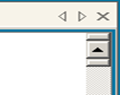
You
can navigate between selection sets in Inventory viewer using the forward and
backward arrows located at the top of an asset cell.
|
|
CM
evolveIT will keep track of previous sets of asset selections. For example, after selecting 3 different
selection sets, CM evolveIT allows the user to return to a previous selection
set, as follows:
Selection
Set 1 (4 programs)
Selection
set 2 (8 programs)
Using
the forward and backward arrows, you can switch between these two prior
selection sets. Additionally, CM
evolveIT provides a selection set list pop-up that can be used to select any
set from the saved list. By clicking on
the up/down arrows located between the forward/backward arrows, CM evolveIT
presents the following pop-up box list of previous selection sets:
3.2 Inventory Asset
Relationships
CM
evolveIT builds a repository of information about your source code during the
automated discovery process.
Identification of Inventory Asset relationships is part of that
process. Within your inventory, each
asset has a direct relationship with other assets. For example, a job has a direct relationship
with all of the Application and System programs executed within it through JCL
EXEC statements. Those programs have
direct relationships with copybooks used within each program. During automated discovery, CM evolveIT
identifies all of the relationships within your source code. These relationships give CM evolveIT its
enormous interactive documentation and analysis capabilities.
Selecting
Application Program LC0135PG in the Application Program asset cell provides a
wealth of information about LC0135PG through highlighting and
colorization.
Simply
by selecting LC0135PG, we are able to identify all other inventory assets that
have a direct relationship with it, as identified by the highlighting and
colorization that appears in the other asset cells. The same relational information can be viewed
on any other inventory asset simply by selecting the asset.
In the
next section we will discuss the inventory viewer Colours sidebar which will
provide information on relationship colorization.
For
additional information on asset relationships, see Appendix B.
3.3 Inventory Viewer
Sidebar
The
inventory viewer sidebar is comprised of four sub bars; Layouts, Current
Display, Current Cell and Colours. Current
Display, Current Cell and Colours will be discussed in detail in later
sections. Current Display is the default sidebar
selection when CM evolveIT is opened.
3.3.1 Sidebar Drop-Down Menu
The
sidebar selection drop-down menu can be accessed by clicking on the
button on the sidebar
header box. In this section, we will
focus on the use of the Layouts sidebar.
3.3.2 Minimizing or “Pinning” the sidebar
The
sidebar can be minimized to increase the viewable area for your layout asset cells
by clicking the
button that appears at
the top, right-hand side of the sidebar.
When minimized, the sidebar will only appear when the pointer is
positioned over the vertical sidebar box.
To maximize the sidebar, position the pointer over the vertical sidebar
and click the
button.
3.3.3 Colours Sidebar
The Colours Sidebar is used to change and view the meanings
of the different colours within the Inventory Viewer.
Selection
Mode
This drop down box controls which set of Inventory Viewer
colours to view/edit. There are 3 color sets in CM
evolveIT; General, Highlight and Attributes.
General
The General section is the default panel & displays the
colours used for the general appearance of items within the Inventory
Viewer.
Highlight
The Highlight section is a key for the Inventory Viewer's
top level impact analysis feature. Within
this section you can change the colouring of the types of relationships in
the Inventory Viewer.
Attributes
Colour
Changing
To
Change a colour, select the item you want to choose a new colour for and click
on the
button.
3.3.4 Layouts Sidebar
The Layouts Sidebar is used to manipulate the cells that the current Inventory Viewer contains.
Current layout box
The Current Layout box is used to directly change the
current Inventory Viewer contents. This control allows you to add assets to a
layout and save a layout so it is available for use with any inventory.
Button
To add a new cell to the Inventory Viewer:
1.
Select the desired item(s) from the list.
2.
Select a destination cell within the Inventory Viewer by clicking on its title bar (be aware
that the current area of the destination cell will be cut in half to allow room
for the new item).
3.
Click on the
button.
Button
To save the current arrangement of cells within the Inventory Viewer as an available layout:
1. Click the button.
2. Choose save
options from the window displayed below:
Save layout options:
: Allows the arrangement of cells in the Inventory viewer layout to be used with any CM
evolveIT Inventory.
: Restricts the use of the layout to only the current
Inventory.
: Allows sharing
the layout with other users on the server.
: Restricts
access to the layout to the current user.
Once the
desired options are selected, type in the name under which you want to save the
layout and click on the button.
Button
The Make Default button will create a <My Default> layout based on the layout of
the current cells in the Inventory viewer. <My
Default> will be applicable to all Inventories for the user.
Available layouts box
The Available Layouts box allows a user to choose
between a set of layouts that have been
previously configured and can be applied to the current
Inventory.
Button
The New Layout... button will launch the Populate Inventory Viewer Window and replace the current
layout of cells in the Inventory Viewer
with the new selection from the Populate Inventory Viewer Window.
Button
The Open Layout button is used to open a layout selected from the list above the button. When CM evolveIT opens the selected layout the current
layout of cells within the Inventory Viewer
is replaced with the selected layout.
Button
3.3.5 Current Cell Sidebar
Each
cell within an Inventory Viewer layout contains a different inventory asset
type. The Current
Cell Sidebar is used to perform actions at a cell specific level.
Cell Name
Cell Name is a title bar which displays
the name of the currently active cell.
Attributes
Attributes
appear in asset cells as colorized exclamation marks next to assets that have
been identified as having attribute characteristics during the automated
discovery process. The Attributes box controls which Attribute is displayed within a selected Cell. Each
asset type has a set of associated attributes.
For information on the attributes available for each asset type and the
description of each attribute type, see Appendix A.
To
Change the current Attribute shown within
the currently select cell:
Click on
the Drop down box,
.
Select
the Attribute to show.
Find
The Find section focuses on searching for items within the currently selected cell and allows automatic selection of
these found items.
Finding assets within a specific cell
To use
the Find to locate items within an asset
cell:
Type
your search text in the Find Box.
Click
the
button.
The results of the search will be marked in the Inventory Viewer with a coloured border around each item that contains the search string.
Button
The Select Marked button will select the items that have a border
around them within the selected cell.
To use Select
Marked:
Complete
a Find (as described previously).
Click on
the cell containing the items to select.
Click
.
Button
The
Clear Marks button is used to erase marks from the currently selected cell.
To use Clear Marks:
Select
the cell from which the selection marks are to be removed.
Click
3.3.6 Current Display Sidebar
The Current Display Sidebar contains tools to affect
the current Inventory Viewer, with
different methods of manipulating items
across all of the currently viewable cells.
Display
The Display section determines which items are displayed in
the Inventory Viewer based on the items selected.
Filter View:
When checked displays assets in
the current display depending on the
selection of Showing(Highlights)
and Exclude options. The colours of
the assets describe the type of relationship that exists.
Showing(Highlights)
All
Items Displays all assets in all of the cells.
Highlighted Items Only Displays all assets in all of the cells which
have a relationship to the asset selected.
Unhighlighted Items Only Displays all assets in all of the cells which
have a relationship to the unhighlighted asset.
Exclude (Attributes)
Nothing includes all attributed assets
Items without an Attribute: Displays
only the items that do not have an attribute.
Items with an Attribute: Displays
only the items that have an attribute.
The Find section is used to locate all occurrences of
the search text within the current Inventory Viewer.
To use
the Find command, type the search text into the box and click on the
button.
After
running the Find, CM evolveIT will display a summary of the results. It will also ’Mark’
all of the search results. A pop-up window will appear which states how
many assets were found.
To
proceed, simply select the asset and click on the ‘Selected Marked ’
button. Then the Close button.
Copybook has been selected. The results are displayed in the example
below.
After
selecting an asset, click on the ‘Show Unrelated Items’ box to only see the
items related to the marked items in the selected asset cell.
Notice
the colorization of the ‘marked’ assets in the Copybook asset cell & the related
assets in the Application Program asset cell.
The highlighted assets in the Copybook asset cell represent the ‘marked’
copybook from the Find.
Button
The Clear Marks button removes all of the marks from
the Inventory Viewer.
Selection
Select
Marked Items in’ button. A drop down
will appear with a list of the asset cells to choose from.
Button
The Clear Selection
button removes all internal tags of the previously selected items in Inventory
Viewer.
Add to View
3.3.7 Interface Sidebar
The Interface Sidebar contains tools to give the ability for the User to configure
the Items & Relationships to be considered when drawing Interface Diagrams.
Saved Aggregate
The Saved Aggregates box
displayed all saved previous aggregates that can be used to create Interface
diagrams.
All
The All button will check all the Saved Aggregates in the
display window.
None
None button will clear all checks from the Saved Aggregates
in the display window.
Actions
Actions sidebar is where you selected from the inventory
viewer what assets you want included in the aggregate which will help create
the interface diagram.
Use
From Highlight
Use both selected and
highlighted entries from the current IV cells
From Selected
Use current IV
selection.
From Marked
Use currently marked IV
items
From Checked
Use (only) checked
Aggregates from the list.
1. By default an
Interface Diagram is based on a list of Item the diagram is constructed by
creating a ‘normal’ diagram based on all relationships existing between
any of the listed types, & then aggregating based on the Aggregate objects
provided. You can edit this file, if you want to change the global
defaults.
2. By
defining a User Configuration – click the ‘gears’ icon next to “Interface
Diagram” in the “Interfaces” sidebar – the User can define exactly which
relationship types are considered when building the initial diagram before
aggregating. Effectively you just need to define here the relationships
that determine interfaces.
3. Once a
configuration has been defined, it will apply to all Interface Diagrams built
from that point until CM evolveIT is closed, or until the configuration is
changed. Configurations do not persist between sessions.
Interface diagram
By selecting saved aggregates and click this button user can create
Interface diagram.
New Aggregate
After selecting assets in Inventory
Viewer assets that you want to use for aggregate, choose the Use button, and
click this button and pop-up will appear asking the user to name the aggregate.
Then it will appear in the Saved Aggregate List.
Add to Aggregate
This option is only highlighted
when a Saved Aggregate is checked and gives the user the ability to add to
Saved Aggregate.
3.4 Inventory Views
Inventory views are asset subsets of an CM evolveIT inventory. When automated discovery is completed, CM
evolveIT creates a default Master view which contains all assets in the
inventory. Child views can also be
created which contain subsets of the Master inventory, providing to focus in on
inventory assets that are of particular interest to the user. In
this section, you will learn how to open, create rename and delete CM evolveIT
inventory views.
Important Note about CM
evolveIT Views
A
default Master view containing all inventory assets is created for every new CM
evolveIT inventory at the completion of automated discovery. CM evolveIT child views are “snapshots” of
the selected assets in the Master view.
If an inventory asset is updated, rediscovered and cross-referenced into
the inventory and Master view, all child views that contain the asset must be
updated with the updated version of that asset.
3.4.1 Creating an CM
evolveIT Inventory View
There
are two ways to create an Inventory View within CM evolveIT.
Creating a View from the Inventory Sidebar
Current Display:
1.
Click
the
button on the Inventory
Viewer sidebar header box to access the sidebar menu and select “Current
Display”.
2.
Click on
the
button to access the Add to View box.
3.
Click on
the
button to access the New View box.
4.
Select the
Master View from which to populate the new view, type the name of the new view
in the Name box and click the now active
button.
5.
Click on
the
button to access the
Add to View box. Select the newly
created view and the asset cells in the Add from Cells list to populate the new
view.
6.
Click
the
button and CM evolveIT will populate the new
view.
Note: Add more assets to the view by repeating
steps 2 through 6.
Creating a View from the Home
Screen Views Window:
1.
Click
the Home tab from within Inventory Viewer or select Change Inventories from the
option bar File menu to access the CM evolveIT Home screen.
2.
Click on
the
button to access the View Management box.
3.
Click
the
button to access the New View box.
4.
Select
the Master View from which to populate the new view, type the name of the new
view in the Name box and click the now active
button.
5.
Close
the View Management box by clicking the
button. The
new view will appear on the Home screen views list under the Master View
selected for population.
6.
Select
the Master view from which to populate the new view and click
to open the master view in Inventory Viewer.
7.
Click
the
button on the
Inventory Viewer sidebar header box to access the sidebar menu and select
“Current Display”.
8.
Select
the items to add to the view.
9.
Click on
the
button to access the Add to View box. Select the newly created view and the asset
cells in the Add from Cells list to populate the new view.
10. Click the
button and CM evolveIT will populate the new
view.
Note: Add more assets to the view by repeating
steps 7 through 10.
3.4.2 Opening an CM evolveIT
Inventory View
To open
a view, navigate to the CM evolveIT Home screen to access the CM evolveIT
Inventory View Management Window. Expand
the Master inventory view associated with the child view to be opened,
highlight the child view to be opened and click on the
button.
3.4.3 Renaming an CM
evolveIT Inventory View
To
rename a view, navigate to the CM evolveIT Home screen to access the CM
evolveIT Inventory View Management Window and click on the
button.
On the View Management box, highlight the
view to be renamed and click on the
button.
Type the new name given to the view and click
.
3.4.4 Deleting an CM
evolveIT Inventory View
To
delete a view, navigate to the CM evolveIT Home screen to access the CM
evolveIT Inventory View Management Window and click on the
button.
On the View Management box, highlight the view to be deleted and click
on the
button.
Note: The view being deleted cannot be open in
Inventory Viewer. Close the view before
deleting it.
3.5 Section 3 - Knowledge
Exercises
(1). Create an CM evolveIT layout containing
only Application Programs, System Programs and Copybooks.
(2). Using the Layout sidebar Current Layout
box, add asset cells for Jobs, Physical Files and External Files to the new
layout.
(3). Arrange the asset cells in the new layout
as follows:
Row 1: Application Programs, System Programs, Jobs.
Row 2: Copybooks, Physical Files, External Files.
(4). Save the new layout with the name
“Training1”.
(5). Close all asset windows and reopen layout
“Training1” from the Populate Inventory Viewer Layouts Tab.
(6). Search within the Physical Files asset
cell for files containing the characters “SCHOOL”. Select all of the files that were identified
by the search and note all of the relationships highlighted in other asset
cells below along with information about what type of relationship these files
have with each highlighted asset.
Application Programs: Asset Name Relationship Type
|
|
|
Jobs:
Asset Name Relationship Type
|
|
|
External Files: Asset
Name Relationship Type
|
|
|
|
|
|
|
|
|
|
|
|
(6). Clear all of the find marks around the
four Physical Files found by the search.
(7). Select the Application Program that has a
relationship with the four Physical Files found and limit the view of the
assets to:
·
View only selected (highlighted) assets within
all asset cells. While viewing only
highlighted items, view only highlighted assets that are marked with attribute
marks, then view all attributed/unattributed again.
·
View only unselected (un-highlighted) assets
within all asset cells.
·
View all assets again.
(8). Find all inventory assets in all asset
cells that contain the word “LC013” and select all Application Programs marked
by the search.
(9). Create a new view that contains only the
assets associated with the selected Application Programs. Call this new view “LC013View”.
(10). Open the new view “LC013View” and browse
through the assets in Inventory Viewer briefly.
(11). Open the Master view of the inventory and
delete the child view “LC013View”.
(12). Take a few moments to browse through the
Colours sidebar, changing various colorization options for general layout
colors, attribute colors and relationship colors.
4. Inventory Viewer Sub Menus
Learning Objectives:
Upon completion of section 4,
students should:
· understand how to access, navigate
and use the report and diagram sub menus
· know the different kinds of preconfigured
standard reports and diagrams available in CM evolveIT
· be able to create custom reports and
diagrams using the report and diagram configuration selection list
· know how to access and use the report
and diagram sidebars
· be able to save and reuse report and
diagram configurations across like asset types
· know how to export report text and
diagram graphics for use in external documents
· know how to use CM evolveIT’s diagram
navigation tool
· understand the content of, know how
to access and use the coding element sub menus to gather intelligence and
conduct drill-down analysis of an inventory
Topics
Asset Sub
Menus
4.1
Asset Sub Menu
Each asset type in an CM evolveIT
inventory has a sub menu that serves as a starting block for exploration of
your inventory. The asset sub menu can
be accessed by selecting an asset or multiple assets in an asset cell and then
right-clicking on the selected item(s).
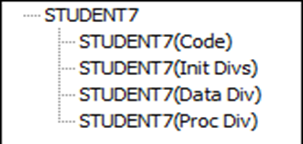
Code Access: Provides direct links to asset code. Code viewer will be covered in a later
section of training.
Code (full),
Initial Divisions, Data Division, Procedure Division, View Expanded Source (Untagged)
Standard Diagrams: Provides direct links to diagrams that come
preconfigured in CM evolveIT.
Control Flow Diagram
Report and Diagram Sub Menus: Provides access to report and diagram
configuration menus.
Diagrams, Reports
For a list of Asset Sub Menu Options by Asset
Type, see Appendix C.
4.2 Report and Diagram Sub Menus
Report and
Diagram Sub Menus provide access to additional Standard Control and Data Flow
Diagrams as well as access to CM evolveIT’s powerful customized Report and
Diagram configuration capabilities.
Standard Diagrams: Provides direct links to diagrams that come
preconfigured in CM evolveIT.
Job Flow Diagram, Control Flow Diagram
Predefined Diagrams: CM evolveIT comes with predefined Diagrams
Column-Pgm (Read-Write)
Column-Table
Copybook-Pgms
Job-Pgm Call Tree
Job-Pgm-All SubPgms Call Tree
Job-Physical File(Read-Write)
Job-Proc-Parm
Job-Proc-Pgm
Parm-Job-Proc
Pgm-Called By Pgms
Pgm-Calls Pgm
Pgm-Columns
Pgm-Copybooks
Pgm-External File( Read-Write)
Pgm-Table-Columns
Pgm-Table
Physical Dataset- Physical File
Physical Dataset-Job
Physical File- Physical Dataset
Physical File-Job
Physical File-PGM(Read-Write)
Proc-Called Proc
Proc-Jobs
Proc-Parm
Proc-Pgms
System Pgm-Proc
SystemPgm-Job
Table-Columns
Table-PGM(Read-Write)
Trans-Pgm(Returned To and From)
Customized Diagrams: User creates diagrams using CM evolveIT
configurations.
New Diagram
Predefined Report: CM evolveIT comes with predefined Reports:
Copybook-Pgms
Job-Pgm Call Tree
Job-Pgm-All SubPgms Call Tree
Job-Physical File(Read-Write)
Job-Proc-Parm
Job-Proc-Pgm
Parm-Job-Proc
Pgm-Called By Pgms
Pgm-Calls Pgm
Pgm-Columns
Pgm-Copybooks
Pgm-External File( Read-Write)
Pgm-Table-Columns
Pgm-Table
Physical Dataset- Physical File
Physical Dataset-Job
Physical File- Physical Dataset
Physical File-Job
Physical File-PGM(Read-Write)
Proc-Called Proc
Proc-Jobs
Proc-Parm
Proc-Pgms
System Pgm-Proc
SystemPgm-Job
Table-Columns
Table-PGM(Read-Write)
Trans-Pgm(Returned To and From)
Customized Reports: User creates reports using CM evolveIT
configurations.
New Report
4.2.1 Standard Reports and Diagrams
The asset sub menu also lists standard
reports and diagrams that can quickly be generated.
4.2.2 Custom Reports
Selecting “New Report…” from the Report sub
menu will open the Cross-references to Report configuration window. This window provides a pick list of all
assets types in the inventory that can be included as a cross-reference item
for the report.
The
expanded report asset cross-reference list allows for any type of application
intelligence to be included on the report.
To create a report containing the names of batch jobs that execute the
selected program as well as any application or system programs called by the
selected program, the following selections would create a report containing the
information:
4.2.3 Reports
Sidebar
When a report tab is active and selected, the
Report Sidebar will appear. This sidebar
allows you to navigate quickly through all open reports and save the
configuration for an active and selected report for use on other Inventory
Assets. The Reports Sidebar is comprised
of two sidebars; Current Report and Other Reports.
This Sidebar can be minimized and maximized
by pinning the sidebar as described previously.
Other
Reports Sidebar
The Other Reports Sidebar is used to navigate
through all of the currently opened Reports by their title name.
Reports
The Reports section contains a tree listing
of all of the currently open reports in CM evolveIT.
To switch
to one of the reports in the tree view; click on the report to open, and CM evolveIT will switch to
the selected report.
Current
Report Sidebar
The Current
Report Sidebar is used to perform tasks on the Current Selected Report.
Configuration
The configuration section contains controls
relating to the setup of the current diagram.
The Save...
button is used to save the current setup of the diagram for use on other inventory
assets.
To save a diagram configuration click on the Save button and type a name for the new configuration
in the new Save Configuration window then
click on Save.
Export
To export a report to a file,
click the ‘To File’ button on the Current Report Sidebar.
A pop-up will appear to enable saving
the report to the desired destination.
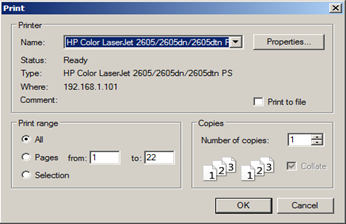
Printing
To print the selected report, use the ‘Print’ button. The ‘Print’
button will print the selected report using
the windows default printer dialog box and
allow the user choose their own specific printing options.
Cut/Paste
Standard Windows Cut (CNTL-C) and Paste (CNTL-V) operations can be
used to copy report text for inclusion in external documents. Simply
drag the mouse to highlight the area of the report to be copied, then Paste the
text into the external document.
4.2.4 Custom
Diagrams
Selecting “New Diagram…” from the Diagram sub
menu will open the Diagram/Report Configuration window. This window provides a pick list of all asset
types in the inventory that can be included as an asset relationship in the
diagram.
The
expanded Diagram/Report Configuration list allows for any type of application
intelligence to be included in the diagram.
To create a diagram that provides a visual representation of the batch
jobs that execute the selected program, as well as any application or system
programs called by the selected program, the following selections would create
such a diagram:
4.2.5 Diagrams Sidebar
When a diagram tab is active and selected, the
Diagram Sidebar will appear. This
sidebar allows the user to navigate quickly through all open diagrams, modify
the colorization of diagrams and save the configuration for use on other
inventory assets. The Diagram Sidebar is
comprised of three sidebars; Current Diagram, Other Diagrams and Colours.
Current
Diagram Sidebar
The Current
Diagram Sidebar is used to perform tasks on the Current Selected diagram.
Operations
Operations are tasks that can be performed on
the currently selected Diagram.
Print
The Print... button
will print the currently selected diagram
by bringing up the computer’s default printing
dialog. The Print... button will only prints the diagram, not
the surrounding CM evolveIT sidebars or Properties box.
Copy All
The Copy All button
will copy the currently selected Diagram onto the clipboard, and may be pasted
into any other application that allows the pasting of images from the
clipboard, such as paint, and word processors. The Copy All button
will only copy the diagram, not the surrounding CM evolveIT sidebars nor the Properties
box. Simply click on the Copy All
button, and then use the standard Windows Paste (CNTL-V) to paste the diagram
image into the external document.
Note: In some cases, diagrams will be too large to
fit neatly onto a page of an external document.
When this occurs, simply paste the diagram into a graphic editing
application and decrease the size of the diagram before pasting it into the
document.
Other
Diagrams Sidebar
The Other
Diagrams Sidebar is used to navigate between currently opened Diagrams.
Diagrams
The Diagrams Section
contains a list of the opened Diagrams
within each currently opened inventory.
To switch
to a different Diagram, select the name of the diagram to view in the list.
Diagram Colours Sidebar
The Colours Diagram Sidebar is used to
change the colours on the diagram.
Style
The
Style section controls what type of colour fill to give the diagram.
Single
solid colour fill will give the diagram one colour across all of the items
within the diagram.
Dual
gradient colour fill will give the diagram two colours across all of the items
within the diagram. Colour one fades
into colour two. Dual gradient colour
fill has the option to specify which direction the gradient should flow. The options in the drop down list are:
Vertical, from top (colour one) to bottom (colour two).
Horizontal, from left (colour
one) to right (colour two).
Forward Diagonal, from top left (colour one) to bottom right (colour two).
Backward Diagonal, from top right (colour one) to bottom left (colour two).
After
selecting the style type, click on the Apply Style button to change the
diagram.
Colours
The
Colours section controls the colour of the style applied to the diagram.
Gradient colour one:
The first colour that will be used in the Dual gradient colour
fill. It is also the colour of the
Single solid colour fill.
Gradient colour two:
The second colour that will be used in the Dual Gradient colour fill.
Text Colour:
The colour of the text in the diagram.
Control Flow: The colour
of the control flow arrows in the diagram.
Uncategorized: The colour
of uncategorized control flow arrows in the diagram.
Containment: The colour of diagram arrows which represent
‘containment’ relationships.
(i.e. database
contains table, table contains column, program contains nested subprogram,
etc.)
Dataflow:
The colour of the dataflow arrows in the diagram.
Trace Flow:
The colour of the trace flow arrows in the diagram.
|
Colour
Changing |
To Change a colour, select the current colour to be changed, click on the
4.3
Diagram Navigation and Tools
There are two ways to navigate a diagram. One is by using CM evolveIT’s built-in Tools Panel and the other is via use the mouse.
Tools Panel
To Access the Tools Panel for the
diagram, hover your mouse over the Tools magnifying glass icon.
|
Tool panel closed |
Tool Panel Expanded |
|
|
Tool Controls
Directional Control Zoom Bar Control Buttons
Control Button Functions
Zoom Selection
Zoom selection allows for the
user to focus in on an area of a diagram.
Click the
button and select an area of the diagram by holding the left
mouse button and dragging the mouse pointer across the area of focus.
Reframe All
Reframe all reframes the
diagram within the available tab window space, based upon the maximum width or
height of the diagram; whichever is the maximum required to fit the entire
diagram into the available space.
Reframe by Width
Reframe by Width reframes the
diagram within the available tab window space based upon the maximum width of the
diagram.
Reframe by Height
Reframe by Height reframes the
diagram within the available tab window space based upon the maximum height of the
diagram.
Dragging
and Zooming with the Mouse
CM evolveIT allows the user to drag and drop a
diagram by placing the mouse over a portion of the diagram, holding the left
mouse button and dragging the diagram to a new position.
When using a scrollable mouse, zoom in and out
on a diagram very quickly by using the scroll wheel control on the mouse.
4.4 Diagram Object Sub Menus
Each object within an CM evolveIT diagram can
be selected for creation of additional reports and diagrams or for expansion of
the current diagram. Diagram object sub
menus can be accessed by selecting an CM evolveIT diagram object and
right-clicking on it. Except for an
additional “Expand” option, these sub menus are identical to the Inventory
Viewer Asset Sub Menus previously discussed.
4.4.1
Creating Additional Diagrams
The same options for creating additional
diagrams that were available through the Inventory Viewer Asset Sub Menus are
available via the diagram object sub menus.
Users can create additional standard and custom reports and diagrams for
a selected diagram object by following the same steps through diagram
options.
Example:
1. Create a Job Control Flow diagram for Job Asset
STUDJ001 from the Diagrams sub menu.
2. Select the application program diagram object
for application program LC0135PG and right-click to access the diagram object
sub menu.
3. Create a separate System Data Flow report for LC0135PG
from the Reports sub menu.
4. Click on the
button in the upper
right-hand corner of the LC0135PG System Data Flow report to close it and
return to the Job Control Flow diagram for Job Asset STUDJ001.
5. Select the application program diagram object
for application program LC0130PG and right-click to access the diagram object
sub menu.
6. Create a separate Control Flow diagram for LC0130PG
from the diagrams sub menu.
7. Click on the
button in the upper
right-hand corner of the LC0130PG Control Flow diagram to close it and return
to the Job Control Flow diagram for Job Asset STUDJ001.
8. Leave the Job Control Flow diagram for Job
Asset STUDJ001 active for use in the following discussion of diagram expansion.
4.4.2 Expanding Diagrams
An additional Expand option is available in the
diagram object sub menu.
This option can be used to generate additional
diagram intelligence on the active CM evolveIT diagram. Selecting the Expand option will open the
same Diagram/Report Configuration window discussed previously; allowing the
user to select any CM evolveIT asset for inclusion in the diagram of the
selected object.
Example:
1. Select the diagram object for application
program LC0135PG from within the Job Control Flow diagram for Job Asset PLFLA10D. Right-click
to access the diagram object sub menu.
2. Select Expand to access the Diagram/Report
Configuration window.
3. Select options Calls Program/Application
Program and click OK to add additional objects that show programs called by
application program LC0135PG.
Become familiar with the Inventory Viewer Asset
Sub Menus and Diagram Object Sub Menus by creating reports and diagrams for
various Inventory Assets. Also, select
diagram objects for expansion/creation of additional reports and diagrams.
For a list of all sub menu options by asset
type, see Appendix D.
4.5 Section 4 - Knowledge Exercises
(1). Create a Job Flow Diagram and a Control Flow
Diagram for Application Program asset LC0130PG.
Reframe both diagrams such that they are maximized within the viewing
window using the diagram tools.
(2). Navigate between the two diagrams created
in exercise 1 and Inventory Viewer using both the inventory viewer tabs and the
Other Diagrams sidebar.
(3). Leaving the diagrams
open, return to Inventory Viewer and create both a Job Flow Report and Control Flow
Report for Application Program asset LC0131PG.
(4). Navigate between the
reports and diagrams created for LC0130PG using the Inventory Viewer tabs, the
Other Diagrams sidebar and the Other Reports sidebar.
(5). Select the Job Flow
Diagram for LC0130PG and expand the diagram to show the batch job that executes
LC0130PG. Reframe the PLFLC01R diagram such that it is maximized within the
viewing window.
(6). Select the Control Flow
Diagram for LC0130PG and expand the diagram to show all of the application
programs executed by batch job . Reframe
the diagram such that it is maximized within the viewing window.
(7). Save the Job Flow
Diagram created with the name “Control Training 1”. Close the active Job Flow Diagram and return
to Inventory Viewer.
(8). Select application
program LC0135PG and open the saved diagram “Job Control Training 1”. Reframe the diagram such that it is maximized
in the viewing window.
(9). Select the Control Flow Diagram for LC0130PG
and zoom in on a section of the diagram using the diagram tools, then reframe
the diagram such that is it maximized.
(10). Return to Inventory Viewer and create a
new report that lists all copybooks copied by application programs LC0135PG. Save this new report under the name “Copybook
Training 1”. Close the report and open
“Copybook Training 1” for Application Programs LC0131PG.
(11). Using a word processing application, open a
new document and spend a few moments saving a few diagrams and reports to this
external document.
5. Asset Control Flow
Diagrams
Learning Objectives:
Upon completion of section 5,
students should:
· know how to create a Control Flow
Diagram for an Application Program asset and a Job Control Flow Diagram for a
Job from the Asset Sub Menu
· be familiar with the interactive
nature of the Application Program Control flow diagram and understand the
diagram’s objects
· be able to locate, view and
understand Application Program Control Flow diagram governing conditions
· understand the organization of the
Job Control Flow Diagram and its various objects
Application Program Control Flow
Diagram
5.1
Application Program Control Flow
The preconfigured Application Program Control
Flow diagram can be created by selecting an Application Program asset and
right-clicking to access the Asset Sub Menu.
The resulting diagram depicts the control flow
of the selected Application Program.
Initially, this diagram shows only the top level of control flow, but
can be expanded to view all control flow occurring within each paragraph by
double-left-clicking on the diagram paragraph objects.
Diagram Objects
Paragraph structure object
Governing Condition object
External
Call object
|
The
Application Program Control Flow Diagram provides the ability to drill-down
to the governing conditions of the program’s control flow. By right-clicking on a governing
condition object and selecting Governing Conditions from the Diagram Object
Sub Menu, the code associated with the governing condition can be viewed. |
Governing Conditions
5.2 Job Flow Diagram
The pre-configured Job Control Flow diagram can
be created by selecting a Job asset and right-clicking to accessing the Asset
Sub Menu.
The resulting diagram depicts the internal
control flow of the application job and the file usage of each step. Input files are arranged on the left-hand
side of the diagram. Output files are
arranged on the right-hand side of the diagram.
Diagram Objects
Executed program object
Physical
File object
System
program object
As with any other diagram object, additional
intelligence can be accessed by right-clicking on any diagram object to access
the Diagram Object Sub Menu.
5.3
Section 5 - Knowledge Exercises
(1). Select Application
Program asset LC0135PG and create a Control Flow Diagram for it. Take a few moments to expand the control flow
structure of the program and access governing condition code via Diagram Object
Sub Menus. Select paragraph structure
objects and access the code via Diagram Object Sub Menus.
(2). Select Job asset PLFLA10D and create a Job Flow Diagram for it. Take a few moments to review the diagram
structure. Select diagram objects and
access Diagram Object Sub Menus, accessing program code and creating additional
diagrams and reports for each object.
Upon completion of section 6,
students should:
1. know
how to access and use the code viewer to drill-down into asset source code for
analysis
2. know
how to access and use the code viewer sidebars
3. Understand
the content of, know how to access and use the coding element sub menus to
gather intelligence andconduct drill-down analysis of an inventory
4. Understand
how to access and use text document quick find
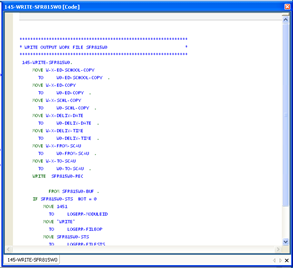
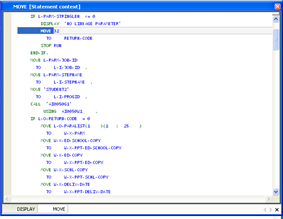
6.1 Code Viewer
The asset sub menu provides options to open and view your
code, create module level standard diagrams for the selected asset type as well
as create other standard and custom reports and diagrams for the selected
assets. Viewing your expanded source
code is just a mouse click away.
6.1.1 Code Viewer
Sidebar
The Code Viewer Sidebar has three menu options;
Structure, Perspectives and Text Search.
6.1.2
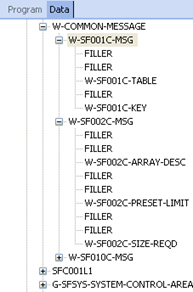
Structure List SidebarThe
Code Viewer Structure Sidebar provides an organized way to view the coding and
data structure of your code via the Program and Data Tabs 
You
can also sort the view of coding and data structure of your code either
alphabetically or in program sequence using the sort sequence tabs
 Sorts
in alphabetically structure name sequence.
Sorts
in alphabetically structure name sequence.
 Sorts in code sequence.
The four Structure Views:
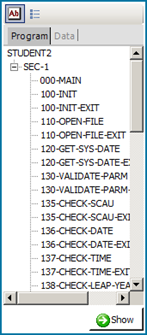
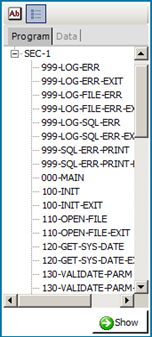
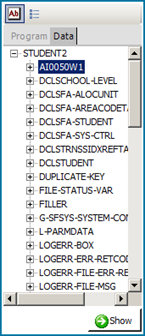
Program/Alphabetical Program/CodeSequence Data/Alphabetical Data/Code Sequence
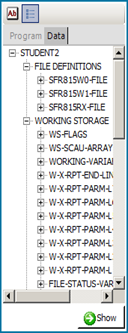
6.1.3 Expanding Data
Structure Tree Items Elements within the Data Structure tree can be
expanded to show all subordinate elements defined within it.
 Button
Selecting  on
a Program Structure element will show the code contained within the selected
paragraph structure.
on
a Program Structure element will show the code contained within the selected
paragraph structure.
Selecting  on
a Data Structure element will show the data structure.
on
a Data Structure element will show the data structure.
Elements within the Data Structure tree can be
expanded to show all subordinate elements defined within it.
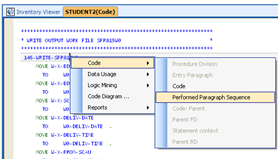
6.1.4
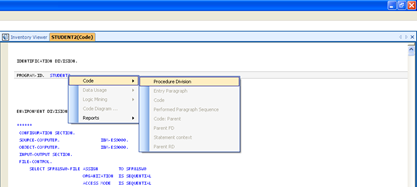
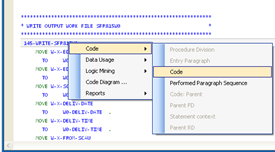
Code Viewer Sub Menus You can also gather valuable intelligence on
your code through code view sub menus. Each coding element in BLUE
CAPITALS or GREEN
CAPITALS can be clicked on with the right
mouse button to bring up a menu to allow access to deeper information about
coding structures, execution summaries, process control flow summaries, data
usage summaries and details, etc. The
type of coding element information available on the sub menus depends upon the
coding element type.
You can also gather valuable intelligence on
your code through code view sub menus. Each coding element in BLUE
CAPITALS or GREEN
CAPITALS can be clicked on with the right
mouse button to bring up a menu to allow access to deeper information about
coding structures, execution summaries, process control flow summaries, data
usage summaries and details, etc. The
type of coding element information available on the sub menus depends upon the
coding element type.
6.1.5 Code Viewer Reports
6.1.5.1 Code Sub-menu
Procedure DivisionActive for: Program ID
Description: This report contains the entire PROCEDURE DIVISION of the
program.
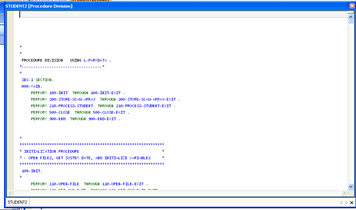
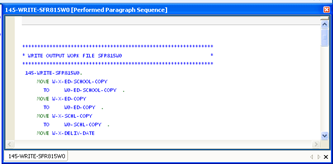
CODE
Active for: Paragraph names that appear in code views and code view
reports.
Description:
This
report contains the PROCEDURE DIVISION code within the paragraph.
Procedure Division
Active for: Paragraph names appearing in PROCEDURE DIVISION and code
sub-menu reports.
Description:
This report
contains the entire code of the paragraph
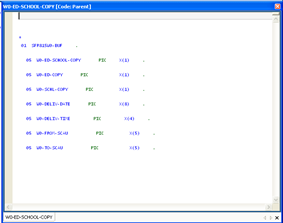
Code: Parent
Active for: Data names in all sections of program code and code sub-menu
reports.
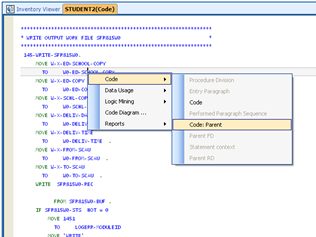
Description: This report contains the entire PROCEDURE DIVISION of the
program.
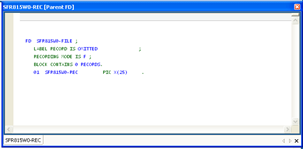
Parent FD
Active for: Record structure 01 level references in DATA and PROCEDURE
DIVISION code.
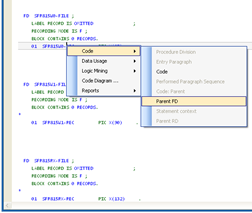
Description:
This
report will show the file definition associated with the 01 level record
structure.
Procedure Division
Active for: All PROCEDURE DIVISION statements. (Tagged GREEN)
Description:
This report will
show the position within PROCEDURE DIVISION of the statement.
Parent RD
Active for: 01 level references associated with Report Writer Report Definitions.
No example available.
Description:
This report
shows the Report Writer File Definition associated with the 01 level references.
No example available.
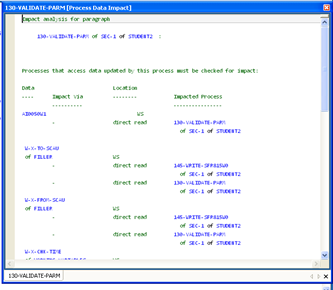
Process Data Impact
Active for: All paragraph name references in PROCEDURE DIVISION and
sub-menu reports.
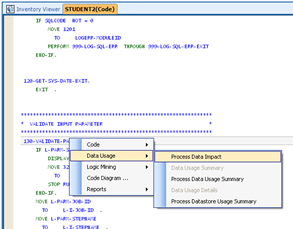
Description: This report contains contextual information about the
paragraph, section and program name and a full list of all data referenced with
the paragraph. Each data detail line
lists the data name, how the data is impacted via read or update, the location
of the data item definition (Working-Storage or Linkage Section) as well as other
paragraphs which reference the data item.
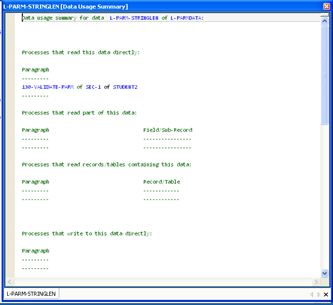
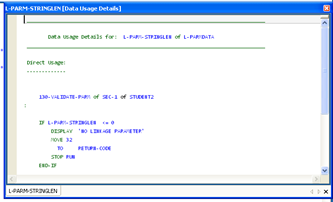
Data Usage Summary
Active for: All data item and paragraph name references in program code.
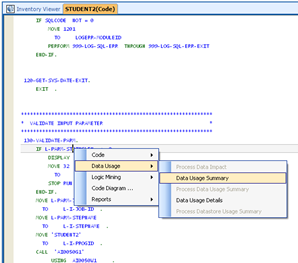
Description:
This report
contains a list of locations of every reference for a data item in
PROCEDURE-DIVISION code and details about related data structures.
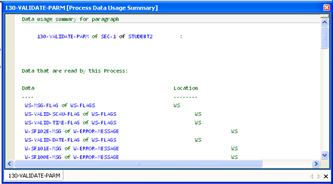
Process Data Usage
Summary
Active for: All paragraph name references in PROCEDURE-DIVISION and
sub-menu reports.
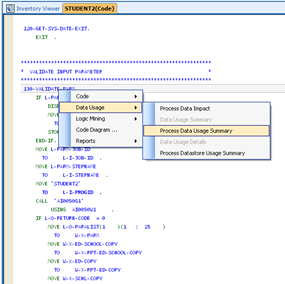
Description:
This report
contains a list of all data items referenced within a paragraph, partitioned by
reference type (read, write and “other”).
Data Usage Details
Active for: All data item references with program code and sub-menu
reports.
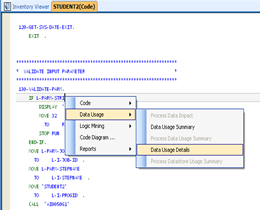
Description: This report contains contextual information and the specific
statement for every PROCEDURE-DIVISION reference of a data item, partitioned by
the type of reference (direct, enclosing record, child field and redefine).
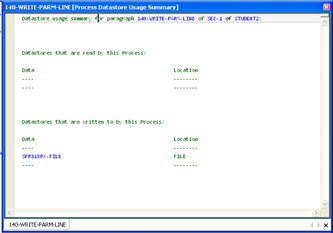
Process Datastore Usage
Summary
Active for: All data item and paragraph name references in
PROCEDURE-DIVISION and sub-menu reports.
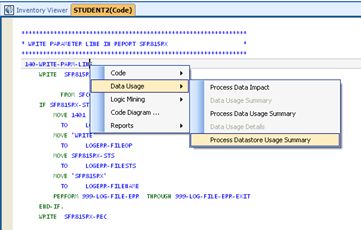
Description:
This
report contains a list of all datastore file name references within the
paragraph, partitioned by reference type (read or write).
6.1.5.2 Logic Mining Sub-menu
Active for: All data item references within program code and sub-menu
reports.Description:
Logic
Mining provides the ability to create detailed diagrams that contain both data
usage/population path and conditional logic information associated with any
data item. Logic mining provides the
unique ability to trace data items across program call boundaries through
Linkage Section references.
Logic Mining is covered
in detail in Section 7 of this manual.
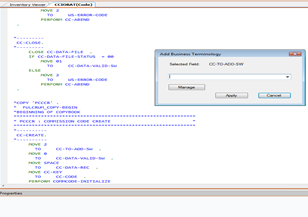
6.1.5.3
Business
Modeling Sub-menu
Active for: All data item references within program code.
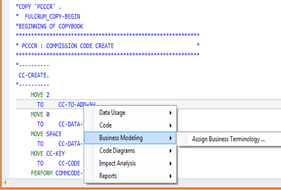
Description: Business Modeling provides the ability to assign business name
to COBOL fields in an application
program. This in aids the business rules
extract to be understood by many more people on your staff.
6.1.5.4 Code Diagram Sub-menu
Active for: All data item and PROCEDURE-DIVISION statement references
within program code and sub-menu reports.
Description:
Code
diagram provides the ability to create detailed diagrams that contain both data
usage/population path and conditional logic information associated with any
data item or PROCEDURE-DIVISION statement.
Unlike Logic Mining, Code Diagrams do not cross program call boundaries.
Code Diagram is covered
in detail in Section 7 of this manual.
6.1.5.5 Reports Sub-menu
Procedure Division
Active for: All data item references in program code.
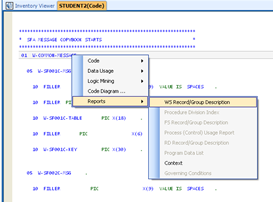
Description: This report contains level information, redefined references,
logical name and a detail reports for every child field associated with data
item.
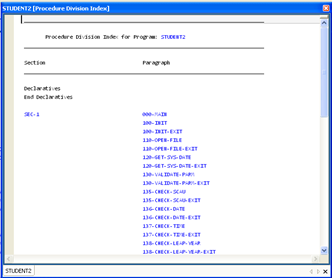
Procedure Division
Index
Active for: On any code reference that is tagged BLUE in program code or sub-menu
reports.
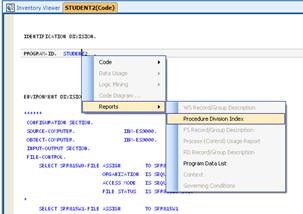
Description:
This
report contains a full list of all sections and paragraphs defined in
PROCEDURE-DIVISION.
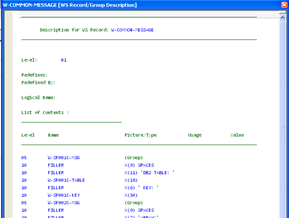
FS Record Group Description
Active for: All 01 level data items in program code or sub-menu reports
associated with a program File Definition.
No example available.
Description: Contains a summary of the File Definition structure
associated with the 01 level.
No example available.
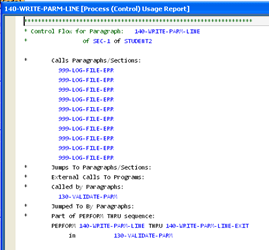
Process Control Usage
Report
Active for: All paragraph name references in program code and sub-menu
reports.
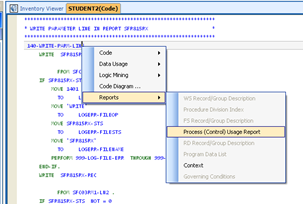
Description: This report contains a list of control flow related
information for the paragraph name, including calling paragraphs, GOTO jumps,
calls to external programs, calls to other paragraphs and PERFORM/THRU
references to the paragraph.
RD Record Group
Description
Active for: All 01 level data items in program code or sub-menu reports
associated with a program Report Writer File Definition.
No example available.Description: Contains a summary of the File Definition structure
associated with the 01 level.
No example available.
Program Data List
Active for:
Program
ID
No example available.
Description:
This report
contains a detailed listing of all data items defined in Data Division,
including level and picture clause information
No example available.
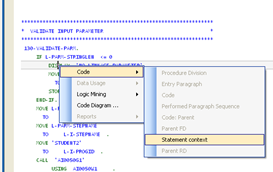
Context
Active for: Data
items in program code or sub-menu reports.
No example available.
Description:
Shows the 01 level data structure
associated with the data item.
No example available.
6.1.6
Perspectives Sidebar
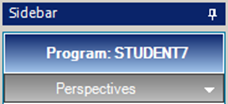
The Perspective List
shows all of the current views open on a
particular Code Item. The top node of the tree is the name of the Code Item, and the Child nodes are the different
open views of the Code Item, allowing you to quickly switch from
one view to another.
The Perspective List
shows all of the current views open on a
particular Code Item. The top node of the tree is the name of the Code Item, and the Child nodes are the different
open views of the Code Item, allowing you to quickly switch from
one view to another.
6.1.7
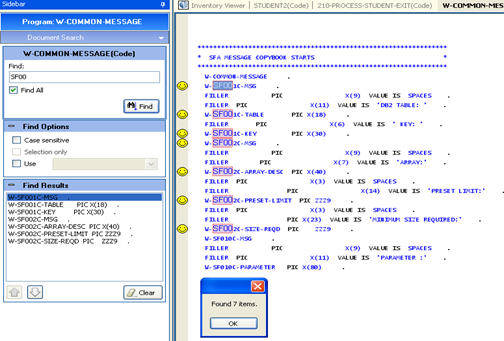
Document Search SidebarThe document search sidebar allows you to
conduct a text search within an active structure selection with various search
options.
 - Will find every instance of
your search text.
- Will find every instance of
your search text. - Will treat your search text
with case sensitivity.
- Will treat your search text
with case sensitivity.
 - Searches a section of code
highlighted in the view window.
- Searches a section of code
highlighted in the view window.
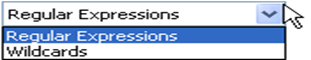
 - Indicates
if you are using Wildcards or Regular Expressions, as indicated via the
associated drop-down menu:
- Indicates
if you are using Wildcards or Regular Expressions, as indicated via the
associated drop-down menu:
Search results are shown in the Find Results
box and are also tagged with a
in the display window.
The document search sidebar allows you to
conduct a text search within an active structure selection with various search
options.
Search results are shown in the Find Results
box and are also tagged with a
in the display window.
6.2 Quick FindText viewers are a Style of tab within CM evolveIT. They are used to display text, such as expanded source code to the
user. There are two styles of Text Viewer,
a Plain Text Viewer, and a Dynamic Text Viewer. However
both have common aspects of functionality, detailed below.
Quick Find
Quick find
is an automatic search tool that is activated when a user starts
typing into a Text viewer.
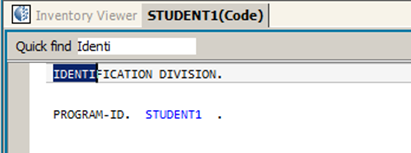
To use the Quick
Find, click inside the main tab of
the Text Viewer.
Start typing
the Find Criteria to look for within the
document.
The Find
will start working immediately,
highlighting the first occurrence of the Find
Criteria.
Note: The Find Criteria is case Insensitive.
To proceed onto the next match,
Press ctrl + I on
the keyboard.
Split Screen
When viewing a Code Viewer, it is possible to
split the tab in half so that there are 2 views on the same piece of code. To achieve this, click on and drag down the
small rectangle, above the scroll bar on the right hand side.
This will cause the code viewer tab to divide
into 2 sections, each being an independent view of the code.
Text
Viewer Operations
The following operations are also available
throughout the text viewers and are located at the bottom of the sidebar:
Print - The Print icon
will print the current document within the
text viewer. By clicking the button it
will open the default printer window.
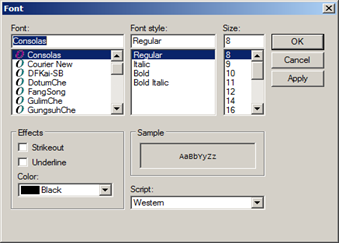
Font - The Font icon
opens the font chooser for the Text Viewer.
The Text Viewer can use any of the fonts
installed on the operating system.
Text viewers are a Style of tab within CM evolveIT. They are used to display text, such as expanded source code to the
user. There are two styles of Text Viewer,
a Plain Text Viewer, and a Dynamic Text Viewer. However
both have common aspects of functionality, detailed below.
Quick Find
To use the Quick
Find, click inside the main tab of
the Text Viewer.
Start typing
the Find Criteria to look for within the
document.
The Find
will start working immediately,
highlighting the first occurrence of the Find
Criteria.
Note: The Find Criteria is case Insensitive.
To proceed onto the next match,
Press ctrl + I on
the keyboard.
Split Screen
When viewing a Code Viewer, it is possible to
split the tab in half so that there are 2 views on the same piece of code. To achieve this, click on and drag down the
small rectangle, above the scroll bar on the right hand side.
This will cause the code viewer tab to divide
into 2 sections, each being an independent view of the code.
Text
Viewer Operations
The following operations are also available
throughout the text viewers and are located at the bottom of the sidebar:
Print - The Print icon
will print the current document within the
text viewer. By clicking the button it
will open the default printer window.
Font - The Font icon
opens the font chooser for the Text Viewer.
The Text Viewer can use any of the fonts
installed on the operating system.
6.3 Section 6 - Knowledge Exercises
(1). Select Application
Program asset LC0135PG. Open a view of
both Data Division and Procedure Division code in code viewer.
(2). Navigate between the
Procedure Division and Data Division code views via both the Perspectives
Sidebar and by using the Inventory Viewer tabs for each view.
(3). Select the Procedure
Division view and sort the structure tree Code Sequence. Open the code for several paragraphs in the
viewer window and navigate between these paragraphs views using the Inventory
Viewer tabs for each. Right-click on
blue coding elements in the paragraph views to access the sub menus and explore
the various menu options.
Close all paragraph views.
(4). Select the Procedure
Division view and sort the data structure by Code Sequence. Expand several Data items completely and open
them to view the data structures in the viewer window. Right-click on blue coding elements in the
data structures to access the sub menus and explore the various menu options.
Close all Data item views.
(5). Select the Procedure
Division view and conduct a few code searches.
Click through the search results to view the code identified by the
search. Right-click on blue coding
elements in the results to access the sub menus and explore the various menu
options.
7. Code Diagramming and Logic Mining
7.1
Code vs. Impact Analysis Diagram Comparison
Code Diagram
Impact Analysis
Presentation
All object types have
a vertical orientation.
Data Items have a
horizontal orientation. Code and
control flow objects have a vertical orientation.
Sidebars
Code view sidebar
only.
Diagram View Sidebar
(diagram window) and Code View Sidebar (code window).
Save Functions
Yes – no user
information can be saved with diagram.
Yes – Diagram Description
and User Notes information can be saved with a diagram.
Type of code elements
Can be created
starting with a data item or a coding statement.
Can be created starting
with a data item only.
Data and logic traced across
program call boundaries
No
Yes
Code Diagrams
are intended to provide diagram functionality depicting the general coding
structure, control flow, governing condition and data use within a single
application program. Impact Analysis
Diagrams are intended to provide diagram functionality focused on coding
structure, control flow, governing condition and data use specific to a single
data item’s set of usage and population paths.
Impact Analysis Diagrams are designed for use in identifying business
logic associated with business rules.
While Code Diagrams provide a wider range of code and data information
and have the ability to depict the same information as Impact Analysis
Diagrams, only Impact Analysis Diagrams provide the ability to save user
information with a diagram. Impact
Analysis Diagrams also have the capability to trace logic and data use across
program call boundaries. Code Diagrams
do not.
If a user wanted to gain a general understanding
of a particular program’s logic, control flow and data usage, Code Diagrams
would be the best choice. If a user
wanted to trace the population path of a data item to document how it is
calculated within the entire system, Impact Analysis Diagrams would be the best
choice. To help better understand the
similarities and differences, both types will be covered in this section.
|
|
Code Diagram |
Impact Analysis |
|
Presentation |
All object types have
a vertical orientation. |
Data Items have a
horizontal orientation. Code and
control flow objects have a vertical orientation. |
|
Sidebars |
Code view sidebar
only. |
Diagram View Sidebar
(diagram window) and Code View Sidebar (code window). |
|
Save Functions |
Yes – no user
information can be saved with diagram. |
Yes – Diagram Description
and User Notes information can be saved with a diagram. |
|
Type of code elements |
Can be created
starting with a data item or a coding statement. |
Can be created starting
with a data item only. |
|
Data and logic traced across
program call boundaries |
No |
Yes |
Code Diagrams
are intended to provide diagram functionality depicting the general coding
structure, control flow, governing condition and data use within a single
application program. Impact Analysis
Diagrams are intended to provide diagram functionality focused on coding
structure, control flow, governing condition and data use specific to a single
data item’s set of usage and population paths.
Impact Analysis Diagrams are designed for use in identifying business
logic associated with business rules.
While Code Diagrams provide a wider range of code and data information
and have the ability to depict the same information as Impact Analysis
Diagrams, only Impact Analysis Diagrams provide the ability to save user
information with a diagram. Impact
Analysis Diagrams also have the capability to trace logic and data use across
program call boundaries. Code Diagrams
do not.
7.2 Code
Diagram
7.2.1
Screen Layout and SidebarsScreen Layout
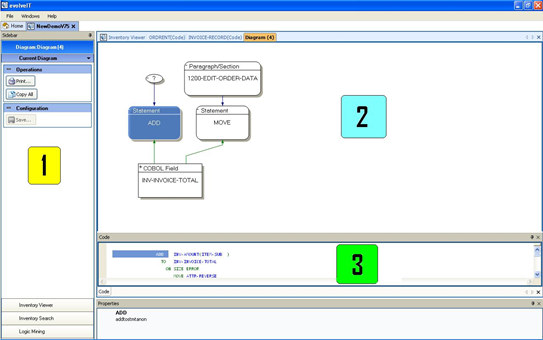
Screen Layout
1 –
Diagram Sidebar
The
code diagram sidebar provides the ability to print, export and save a code
diagram configuration. It also contains
tabs for navigation to Inventory Viewer, Inventory Search and Logic Mining
functionality of CM evolveIT.
2 – Diagram
View Window
Allows
the user to view and interact with a diagram.
2 – Code
View Window
Allows
the user to view and interact with the code associated with a selected diagram
object.
Diagram Presentation
Code
diagrams have an upward and vertical orientation. Diagram objects associated with code statements,
control flow and data items are all presented in both upward and downward
directions, dependent upon the diagram configuration selections.
Starting a Diagram
A
code diagram can be started from any location within CM evolveIT where data
item tagging (BLUE)
and code statement tagging (GREEN) interaction is available. The examples presented in this section are
initiated from a program code view.
Starting a Data Diagram
Right-clicking
on a program statement and selecting Code Diagram will initiate the Diagram/Report
Configuration selection box.
Diagram Presentation
Starting a Diagram
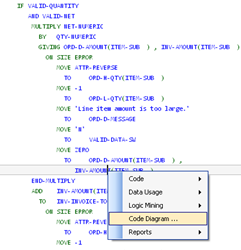
Starting a Statement Diagram
Right-clicking
on a program statement and selecting Code Diagram will initiate the
Diagram/Report Configuration selection box.
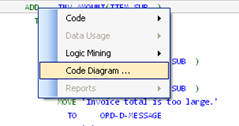
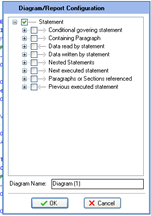
Diagram Configuration Selections
Child Data
Adds any data item that is a
child data item in the data structure.
Conditional Branch Point
Adds any previous conditional
branch point for a statement’s governing condition.
Conditional Governing Statement
Adds the governing condition
associated with a statement’s governing condition.
Containing Paragraph
Adds the paragraph name for
any code statement.
Contributing Statement
Adds the contributing
statement associated with a governing condition.
Data Item
Adds any data item associated
with a code statement.
Data Read by Statement
Adds any data item read by a
code statement.
Data Redefinition
Adds any data item that
either redefines or is redefined by a data item.
Data Written by Statement
Adds any data item written by
a code statement.
Nested Statements
Adds any code statements that
are nested within a code statement’s coding structure. For example, IF statements nested within an
IF/END-IF structure.
Next Executed Statement
Adds the next sequentially
executed statement in the program.
Paragraph
Adds the paragraph that
contains a code statement.
Paragraph or Section
Adds the paragraph or section
that contains a code statement.
Paragraphs or Sections Referenced
Adds the paragraph or section
referenced by a code statement. For
example, the paragraph performed by a PERFORM/THRU statement.
Parent Data
Adds the parent data item
associated with a child data item.
Previous Executed Statement
Adds the previously
sequentially executed statement in the program.
Statement
Adds the code statement
associated with a data items or governing condition.
Statement Reading Data
Adds any statement that reads
a data item.
Statement Writing Data
Adds any statement that
writes a data item.
7.2.3
Diagram Expansion and Interaction
CM evolveIT provides the ability to expand diagrams to
include additional information and powerful interaction tools that allow the
user to focus on and highlight only the information of interest.
7.2.3.1
Expanding a diagram
To expand a diagram to include additional information, simply
right-click on the object you wish to expand and select EXPAND from the
sub-menu to access the Diagram/Report Configuration box for the diagram. Making additional configuration selections
and clicking OK to add the information.
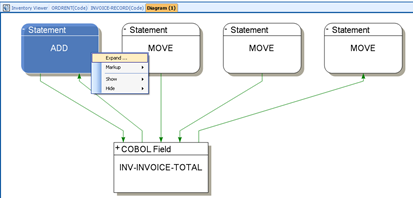
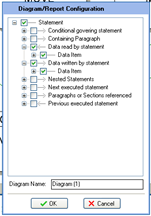
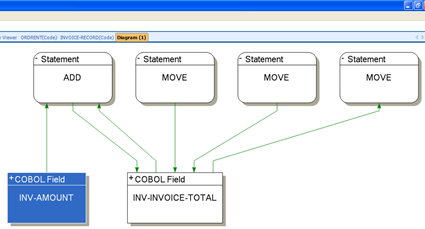
7.2.3.2
Highlighting ObjectsObjects
can be highlighted/colorized by right-clicking an object and selecting Mark
Up\Color. If a color has previously been
selected for highlighting, the same color can be used on additional objects by
right-clicking a new object and selecting Mark Up. If you wish to highlight objects in a
different color once a color has been selected, the color can be changed by
right-clicking and selecting Mark Up\Color again. An object can be unmarked by right-clicking
and selecting Mark Up\Unmark.
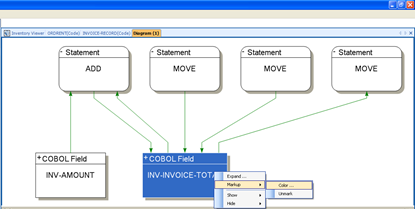
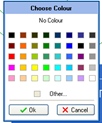
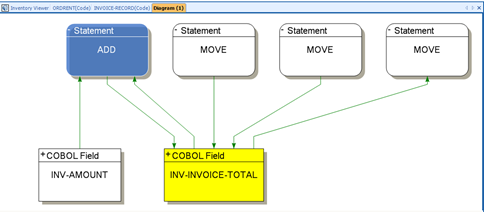
The
resulting diagram looks like this:
In this example the last two boxes are uncheck
and then Apply box is pressed and results are shown. To complete show/hide
press Done
|
|
7.3.1
Screen Layout and Sidebars
Screen Layout
1 –
Diagram Window Sidebar
The
diagram window sidebar is available whenever the user is working in the Diagram
View Window. This sidebar allows the
user to print, export and save a diagram.
2 – Code
View Sidebar
The
Code View Sidebar is available whenever the user is working in the Code View
Window.
3 –
Diagram View Window
Allows
the user to view and interact with a diagram.
4 – Code
View Window
Allows
the user to view and interact with the code associated with a selected diagram
object.
7.3.2
Creating a Diagram
Diagram Presentation
Impact
Analysis diagrams have a horizontal and vertical orientation. Diagram objects associated with code
statements and executions have a vertical orientation when added. Diagram objects associated with data items
have a horizontal orientation when added.
Tracing Direction
You
can mine logic forward or backward. A
forward trace builds a diagram that shows all target data and logic related to
the use of a data item. A backward track
builds a diagram that shows all data and logic related to the population of a
data item.
Program Call Boundaries
One
of the unique aspects of CM evolveIT Impact Analysis diagramming is the ability
to trace processing across program call boundaries. If a data trace path contains a program CALL
statement, expanding the CALL statement will trace data and logic associated
with the data item into the program logic of the called program.
Starting a Diagram
A
code diagram can be started from any location within CM evolveIT where data item
tagging (BLUE)
interaction is available. The examples
presented in this section are initiated from a program code view.
Starting a Forward (Usage) Impact Analysis
Diagram
Diagram Configuration Selections
Code Statement
Adds the code statement
vertically for any expanded data item or governing condition.
Conditional
Adds the conditional object
vertically for any Conditional Governing Statement.
Conditional Governing Statement
Adds the conditional
statement associated with a code statement.
Containing Paragraph
Adds the paragraph containing
a code statement or governing condition.
Data/Statement Impacted(FWD)/Contributing(BWD)
Adds any data written (FWD)
or read (BWD) when expanding a date item or statement.
Fall Thru From
Adds any paragraph from which
program control flow passes via a fall thru.
Follows Paragraph
Adds the paragraph that
precedes the expanded paragraph in procedure division code.
Paragraph
Adds the paragraph object for
any paragraph expansion.
Performed in Paragraph
Adds any paragraph from which
the expanded paragraph is performed via PERFORM/THRU.
Referencing Statement
Adds all code statements that
reference a data item or governing condition.
Statement
Adds the statement object for
any statement related expansion.
7.3.2.1 Hiding/Showing
Objects
It may be helpful at times to use the hide/show functionality
of the diagrams to manipulate objects added by a previous expansion in order to
focus in on an object of interest.
In this example, the program and any program called by it are
selected
To show/hide objects in a diagram, simply select the root object that the
object(s) you wish to show/hide are attached to, right-click and select
Show/Hide. Since objects can be in or out to the root object, select either In
or Out tab and check(show) or uncheck(hide) object from the sub-menu and from
the list of attached objects. You can Hide all objects that are attached or
select a specific object to show/hide.
In this example the
last two boxes are uncheck and then Apply box is pressed and results are shown.
To complete show/hide press Done
7.3.3 Saving and Retrieving an Impact
Analysis Diagram
7.3.3.2 Retrieving/Deleting
a Saved Diagram
You can retrieve and delete a saved diagram from anywhere in the tool by selecting the Logic Mining tab that appears at the bottom of all CM evolveIT sidebars.
This will open a new tab and navigate to CM evolveIT Impact Analysis.
Deleting a Saved Diagram
Find the diagram you wish to retrieve on in the Saved Seams
box on the sidebar and click Delete. The
diagram will be deleted from the list.
Show Processing in Context
To activate this process
simply highlight the program in the Programs Shown in Data Trace sidebar and
RMB and select “Show Processing in Context”
8. CM evolveIT Tabbing Environment
Learning Objectives:
Upon completion of section 8,
students should:
- Know
how to navigate in CM evolveIT’s tabbing environment.
- Be
able to arrange and manipulate the tabbing environment through the tabbing
menus and
manual drag-and-drop.
- Be
able to combine tabs into tabbing groups.
- Know
how to separate text windows into independent pop-up windows.
8.1 Tab Navigation
To navigate between multiple tabs,
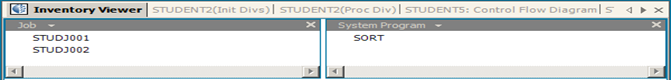
Click
on the desired tab title to view
Alternatively
Use the keyboard shortcut Ctrl + Tab, to move to the next
tab along from the currently selected tab.
If
the desired tab is not viewable due to a large number of open tabs, it may be
accessed by using the scrolls arrows located next to the "x"
on the tabs bar.
These controls will only be active when there are more
tabs than fit the available screen space.
Closing
There
are two ways to close a tab in CM evolveIT
Select the tab to close and click on the X adjacent to the
tab.
Select the tab to close, right-click on the tab and select
Close from the drop-down menu.
Click
on the desired tab title to view
Alternatively
Use the keyboard shortcut Ctrl + Tab, to move to the next
tab along from the currently selected tab.
If
the desired tab is not viewable due to a large number of open tabs, it may be
accessed by using the scrolls arrows located next to the "x"
on the tabs bar.
|
These controls will only be active when there are more
tabs than fit the available screen space. Closing There
are two ways to close a tab in CM evolveIT Select the tab to close and click on the X adjacent to the
tab. Select the tab to close, right-click on the tab and select
Close from the drop-down menu. |
8.2 Tab MenuRight-clicking on a tab will access the tab sub
menu. From this menu, you can manipulate
the location and balance of the selected tab through 4 menu options; Close, Rebalance,
Prominent, New Horizontal Tab Group and New Vertical Tab Group.
Close: Closes the selected tab.
Prominent:
Maximizes the selected tab in the viewing window.
Rebalance: Rebalances the selected tab amongst other
tabs currently open.
New Horizontal Tab Group: Separates the selected tab into a new
horizontal tab group.


New Vertical Tab Group:
Separate the selected tab into a new vertical tab group.
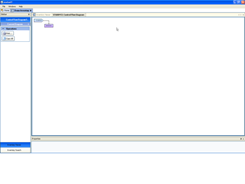

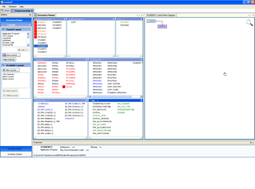
Move to Next Tab Group: Moves the selected tab to the
next tab group on the screen.
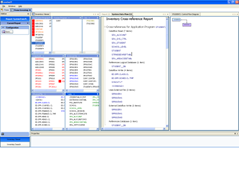

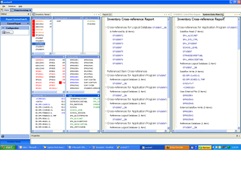
Move to Previous Tab Group: Moves the selected tab to the previous tab
group on the screen.
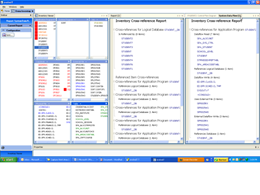

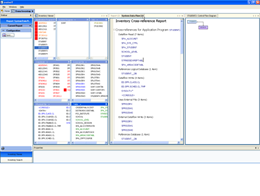
Right-clicking on a tab will access the tab sub
menu. From this menu, you can manipulate
the location and balance of the selected tab through 4 menu options; Close, Rebalance,
Prominent, New Horizontal Tab Group and New Vertical Tab Group.
Close: Closes the selected tab.
Prominent:
Maximizes the selected tab in the viewing window.
Rebalance: Rebalances the selected tab amongst other
tabs currently open.
New Horizontal Tab Group: Separates the selected tab into a new
horizontal tab group.
New Vertical Tab Group:
Separate the selected tab into a new vertical tab group.
Move to Next Tab Group: Moves the selected tab to the
next tab group on the screen.
8.3
Tab Docking
Tabs are capable of being separated from the main tab block and manipulated to create an environment that
contains all of the information a user may want to access at once.
Tabs can be docked in 5 different core locations. Above, To the Right, Below, to the left, and over another tab to add it to the tab stack. When docking a tab, the user
interface will divide the viewing area so that each group of tabs has the same
amount of screen real estate. After tabs
have been relocated the boundaries between tab groups may be shifted to create
more space for one tab group, and less space for another.
To begin manipulating
the interface,
Open documents to view. For instance a diagram, control flow and an
inventory viewer.
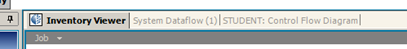
Left click and hold on the Active Tab
and Drag it so that an outline of it appears.
Drag this outline
to a location which you wish to have it relocate
as described above.
Repeat until the user interface has the desired
visual representation of information.
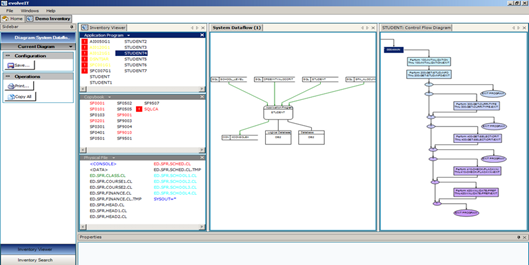
Tabs are capable of being separated from the main tab block and manipulated to create an environment that
contains all of the information a user may want to access at once.
Tabs can be docked in 5 different core locations. Above, To the Right, Below, to the left, and over another tab to add it to the tab stack. When docking a tab, the user
interface will divide the viewing area so that each group of tabs has the same
amount of screen real estate. After tabs
have been relocated the boundaries between tab groups may be shifted to create
more space for one tab group, and less space for another.
To begin manipulating
the interface,
Left click and hold on the Active Tab
and Drag it so that an outline of it appears.
Drag this outline
to a location which you wish to have it relocate
as described above.
Repeat until the user interface has the desired
visual representation of information.
8.3 Popup
Windows
Code viewer windows can be separated from the CM
evolveIT tabbing environment into free-floating windows called Popup
Windows. Below highlighted in Purple is
a Properties window with two Tabs. Highlighted in Blue is a properties window
which is undocked into a popup window.
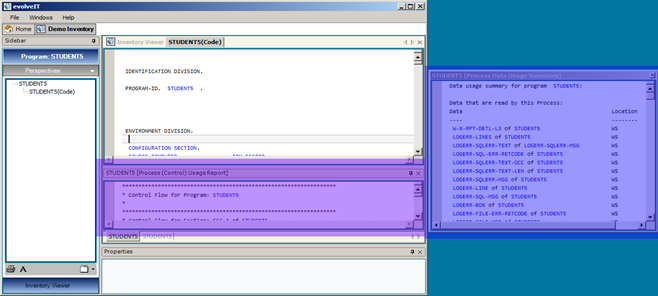
A Popup Window can be manipulated much like a Properties\Side bar. It can
be Docked and Pinned, but may also hold multiple
tabs and Popup windows. Popup windows
will initially appear as docked viewer windows at the bottom of the CM evolveIT
main viewer window, as seen in the example above. They can be separated into floating windows,
as shown on the right-hand side of the above example, by left-clicking the
header bar of the popup window and dragging it to a new position on the
screen. This new floating window can
then be sized as desired.
Popup Window Initialization Default Settings
CM evolveIT provides the user with three
default action settings for initialization of popup windows via the
button that is located
in the bottom right-hand corner of the code viewer sidebar window.
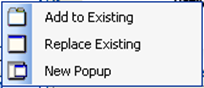
Popup Window Initialization
Options:
Add to Existing: Adds an
additional tab for any new popup window.
Replace Existing:
Replaces any existing popup window with the new popup window.
New Popup: Creates
an additional, unique popup window for any new popup window.
Code viewer windows can be separated from the CM
evolveIT tabbing environment into free-floating windows called Popup
Windows. Below highlighted in Purple is
a Properties window with two Tabs. Highlighted in Blue is a properties window
which is undocked into a popup window.
A Popup Window can be manipulated much like a Properties\Side bar. It can
be Docked and Pinned, but may also hold multiple
tabs and Popup windows. Popup windows
will initially appear as docked viewer windows at the bottom of the CM evolveIT
main viewer window, as seen in the example above. They can be separated into floating windows,
as shown on the right-hand side of the above example, by left-clicking the
header bar of the popup window and dragging it to a new position on the
screen. This new floating window can
then be sized as desired.
Popup Window Initialization Default Settings
CM evolveIT provides the user with three
default action settings for initialization of popup windows via the
button that is located
in the bottom right-hand corner of the code viewer sidebar window.
Popup Window Initialization
Options:
Add to Existing: Adds an
additional tab for any new popup window.
Replace Existing:
Replaces any existing popup window with the new popup window.
New Popup: Creates
an additional, unique popup window for any new popup window.
8.3
Section
8 – Knowledge Exercises
(1). Open several Diagrams, Reports and code
views of your choice on multiple Inventory Assets, using the Tab Menu to create
new tab groups for your new items.
(2). Use the Tab Menu to combine your items into
tab groups, moving them to the previous or next tab group.
(3). Dock your tabs by dragging and dropping them
into different positions within the viewer window.
(4). Open an application program code viewer.
- Access the popup initialization options on the
code viewer sidebar and select option “Add to Existing”. Open multiple popup windows using the code
element sub menus. (HINT: right-click on code elements that are
highlighted blue).
- Access the popup initialization options on the
code viewer sidebar and select option “Replace Existing”. Open multiple popup windows using the code
element sub menus. (HINT: right-click on code elements that are
highlighted blue).
-
Access
the popup initialization options on the code viewer sidebar and select option
“New Popup”. Open multiple popup windows
using the code element sub menus.
(HINT: right-click on code
elements that are highlighted blue).
9. Search Tools
Learning Objectives:
Upon completion of section 9,
students should:
- know
how to access the Text Search sidebar through drop-down menus
- understand
and be able to configure a Text Search using all Text Search Sidebar options
- have
a general knowledge of regular expressions
- know
how to further research standard regular expressions, their syntax and usage
- have
a working knowledge of how Data Search works
- know
how to access the Data Search sidebar through drop-down menus
- understand
and be able to configure a Data Search using all Data Search Sidebar options.
- Be
able to save and recall Data Search Results
- Know
how to use result review options to organize and view Data Search results
- Be
able to print and export Data Search results in text format
- Be
able to export data search results in comma-delimited format.
9.1 Text Search
To access Text Search, click on the Inventory
Search Bar located near the bottom of the Inventory Viewer sidebar to access
the Inventory Search sidebar.
9.1.1 Text
Search Sidebar
The Text Search
Sidebar is used to configure, start, stop
and clear results of the Test Search.
Access the Text Search Sidebar by selecting Text Search from the
Inventory Search drop-down menu located at the top of the Inventory Search
sidebar.
Search For
Regular
Expressions within Text Search
Throughout
CM evolveIT there are options to use Regular Expressions. This topic will give a quick synopsis on what
regular expressions are and some basic information to get started. The CM evolveIT text search supports the use
of regular expressions when searching for text.
What are regular expressions?
The term regular expression is used to describe a series of
characters that are in the language of regular expressions. This language allows for a description to be
built up that can match multiple sequences of characters. For example one expression can be written that
will match “map11” “match34” “match33”.
Regular Expression Resources:
Search In
Current Search
The Current Search
section contains the controls of the Text Search.
Start Button – The start
button begins the search with the options selected in the Search For, and Search
In sections. The Start Button will only be available if a valid
search can be performed, i.e. there is a search phrase and source to search in.
Clear Results – The Clear
Results button will erase previous searches
from the main Text search Tab. The Clear Results button is only available when there
are results to remove.
Whilst a search is running a
new set of controls will be made available, the pause and stop controls. These are available in two locations, on the
progress bar, and in the sidebar.
The sidebar controls appear
in the Current Search section.
Pause
– will pause the current search and can be toggled to resume the search.
9.1.2 Executing a Text Search
The Text Search
is configured and started from the Text Search
Sidebar.
The Results
Pane is a tree Structure.
The (1) main
parent of the tree is the type of result, in the example above, the main
parent is Job, meaning the results below it
are Jobs.
The children
coming from Job, represent the individual Jobs, that contain results, for example (2) STUDJ001.
The children coming
from STUDJ001, are the actual results of the search, (3)”5: //STEP005 EXEC PGM= LC0135PG”.
The actual result
line starts with the line number on which the result can be found in the asset. Clicking
on the Result line will open the result in the Details
pane below with number of lines specified
in the ‘Number Of Lines to Show Box’. The number of
lines can be picked from the drop down list
or entered manually and then refreshed
using the Refresh button.
9.1.3 Push to Inventory
Viewer
The results
of Text Search can be ‘pushed’ to Inventory Viewer.
The results
of Text Search can be ‘pushed’ to Inventory Viewer.
9.2 Data Search
To access Data Search, click on the Inventory
Search Bar located at the bottom of the Inventory Viewer sidebar to access the
Inventory Search sidebar.
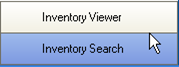
The Data search tool is highly configurable and
allows for much deeper searching in the current view. You
can access the Data Search sidebar by selecting Data Search from the Inventory
Search drop-down menu located at the top of the Inventory Search sidebar.

9.2.1
Search For: Entering Data Search Criteria
The
Search For section has an advanced method of entering search criteria to the
Data Search.
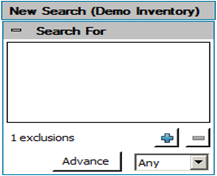
The
Search For section works on a List basis. A list of regular expressions is defined, and
then the mode in which the expressions are used can be determined inside the
drop down box containing Any and All.
All – means that a result must match every item
in the list.
Any
– means that a result must match at least one of the items on the list.
To
add a regular expression to the list, click on the
,
this will create a blank entry in edit mode with the default string of ?match?
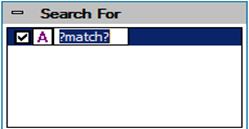
Type
the regular expression to match within the programs, and press enter.
Having entered the regular expression, it is
possible to change what the regular expression will be compared against. The regular expression can be compared against
a Picture or a Dataname. To toggle
between the two, double click on the icon, or right click on the item and
select "Toggle NAME/PICTURE".
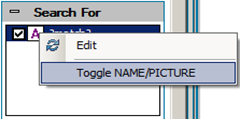
 Represents Dataname search mode
 Represents Picture search mode
The
Search For section works on a List basis. A list of regular expressions is defined, and
then the mode in which the expressions are used can be determined inside the
drop down box containing Any and All.
Any
– means that a result must match at least one of the items on the list.
, this will create a blank entry in edit mode with the default string of ?match?
Type
the regular expression to match within the programs, and press enter.
9.2.2 Search In: Setting Search Scope
The
Search In section has 3 modes.
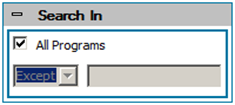
All Programs - Checking
this tick box will override other settings within the Search In box, and search
all of the programs in the current view.
If
All Programs is unchecked then a dropdown box becomes available to configure
how the Search In section interprets the words in the text field next to it.
Only - Selecting
this option will mean that the Data Search only Searches In the programs that
match the regular expression in the text field.
Except - Selection
this option will mean that the Data Search, Searches In all programs except
those which match the regular expression in the text field.
The
Text Field next to the combo box is a validating regular expression field. The
regular expression will be used to match against program names, to either
include or exclude from the search. When
an invalid regular expression is entered the text will turn red, it is
validated as it is typed, so can be used to help generate regular expressions.
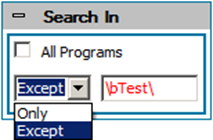
9.2.3
Current Search
Start Button - The start
button begins the search with the options selected in theSearch For, and Search
In sections. The Start Button will only
be available if a valid search can be performed, i.e. there is a search phrase,
and somewhere to search in.
Save as - Will automatically save the
search in the Saved Searches section with the name given in the text box below
it.
Exit on completion - After the Data
Search has been completed, and saved, CM evolveIT will close. Only available
when Save as has been checked.
Whist
the Data Search is running, a new button will appear in the Current Search
section, called Stop. This button will cancel the Data Search.
1. The ‘Match Only’ options in ‘Current Searches’ has an additional option
- Selecting
‘All’ will match the specified
patterns, together with all statements that directly or indirectly access them
– that is the matched Data Items will include both the actual matching items, and parent, child, & redefining items, along with their
processing statements, if any.
- Selecting
‘Direct’ will only match the
specified patterns, with any processing statements – so parent, child and
redefining items will not appear.
9.2.4 Saved Searches
The
Saved Searches section allows control over previous searches that have been
saved.
Refresh - The
refresh button will reload the list of saved searches.
Open - Will open
the currently selected search from the list of saved searches. This is only available when a search is
selected.
Delete - Will delete
the currently selected search from CM evolveIT. This is only available when a search is
selected.
9.2.5 Data Search Screen
Components
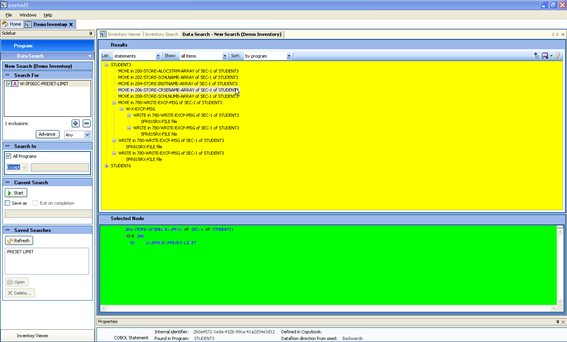
Search Results Window
The Search Results Window provides an expandable tree
structure view of your Data Search results with drop-down menu options to
control the contents and sorting of your view.
Search Results Details Window
The Details Window displays the code associated with the
node selected in the Search Results Window.
Just as with any other code view in CM evolveIT, blue coding elements
provide right-click access to sub menus.
9.2.6
Search Results Viewing Options
Reviewing Data Search Results
Enter
“W-SF002C-PRESET-LIMIT” as your search data item, selecting All Programs in the
Search In box on the Data Search sidebar.
Click Start to execute the search.
The
search results options bar provides the ability to focus-in on the search
results of interest
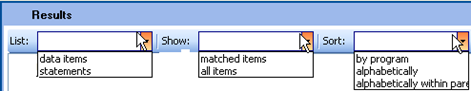
When
all search result viewing options are selected, clicking the
node button located in
the upper-right corner of the Search Results Window will present a hierarchical
tree of the search results based upon the options selected.
LIST Option
This option
indicates whether DATA ITEMS or STATEMENTS will appear at the top level (root)
of a data search node. Each subordinate
node will also list the data item(s) referenced in the associated code
reference at the top of the node.
LIST: data items
In the
following example, a forward trace usage of data item W-SF002C-PRESET-LIMIT is
shown with LIST option of “data items”.
The top node is the search argument data item. The first subordinate node lists parent data
structure W-SF002C-MSG followed by its associated code reference in a MOVE
statement, and so on.
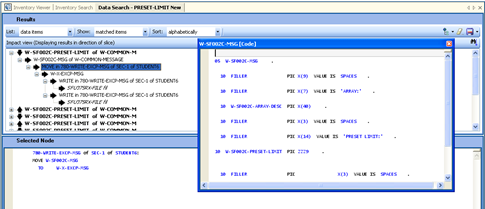
Reviewing Data Search Results
Enter
“W-SF002C-PRESET-LIMIT” as your search data item, selecting All Programs in the
Search In box on the Data Search sidebar.
Click Start to execute the search.
The
search results options bar provides the ability to focus-in on the search
results of interest
When
all search result viewing options are selected, clicking the
node button located in
the upper-right corner of the Search Results Window will present a hierarchical
tree of the search results based upon the options selected.
LIST Option
This option
indicates whether DATA ITEMS or STATEMENTS will appear at the top level (root)
of a data search node. Each subordinate
node will also list the data item(s) referenced in the associated code
reference at the top of the node.
LIST: data items
In the
following example, a forward trace usage of data item W-SF002C-PRESET-LIMIT is
shown with LIST option of “data items”.
The top node is the search argument data item. The first subordinate node lists parent data
structure W-SF002C-MSG followed by its associated code reference in a MOVE
statement, and so on.
LIST: statements
SHOW Option
This option indicates whether the user wants
to see ALL search result items listed as individual top level nodes or only
MATCHED search result items listed as individual top level nodes. Selecting “MATCHED ITEMS” will show all
search results, but will organize them under a single top node that matches the
search argument. Selecting “ALL ITEMS”
will show every search result individually, regardless of their relationship to
the search argument.
SHOW: all items
In the following example, we see how selecting SHOW option
“all items” lists each item individually.
In this case, LIST option “data items” is selected, showing data items
at the top of the nodes. A result node
for W-SF002C-PRESET-LIMIT
shows internal references to W-SF002C-MSG
as well as W-X-EXCP-MSG. However, individual result nodes for W-SF002C-MSG and W-X-EXCP-MSG are also listed
separately, each at the top of their own separate nodes.
SHOW: matched items
SORT Option
Before we
discuss the individual options for SORT, we first need to understand the
default sorting for subordinate nodes within each search result root node.
Subordinate
search result nodes are sorted in a default order of code section, code
paragraph and result item order.
SORT: by program
SORT: alphabetically
<Info on default sorting explaining duplicate items>
SORT:
alphabetically within parent
9.2.7 Search Results Tree
The results
tree now has selectable Check Boxes on each branch
- The
‘border’ checkbox to the left of the tree is a select all/none switch. Checking
it will check all the root branches, unchecking will uncheck everything
- Checking
a branch is only possible if no ‘ancestor’ branch is checked (the check mark implicitly applies to the complete sub
tree).
There is a
new option on the bar above the tree
- This
determines whether or not top level nodes with no children are shown (the
default is ‘Hidden’)
2.
The
Save/Export menu has been re-organized & extended
- ‘Export
All (CSV)’ is the old ‘Export’ option
- The
‘Export Marked (XML)’ option will generate an XML export of the checked branches only, including Code
Fragments for each node.
o Note that XML Export can be a long process (initial estimate about 15-20 nodes/minute, large searches can easily produce 20,000 nodes … so be careful what you export!)
Forward and Backward Trace
Forward Trace
Downward
facing arrows with subordinate rightward facing arrows signify a forward
trace. These nodes represent data usage
wherein the data argument in the search impacts the result of another item.
In the
following example, the impact of W-SF002C-PRESET-LIMIT is traced forward through
code references
.
Backward Trace
Upward
facing arrows and subordinate leftward facing arrows signify a backward
trace. These nodes represent data usage
wherein the data argument in the search is impacted by the usage of other
items.
In the
following example the impacts to W-SF002C-PRESET-LIMIT are traced backward
through code references.
9.2.8
Search Details Window
Show Full Procedure Division Code
View in Embedded Code
By clicking on the Options
on the Menu bar user can toggle the text which is displayed in the Selected
Node. When the option is checked the Selected Node
window will be populated
with the full procedure view.
Unchecked the highlighted
statement and the paragraph it is located is displayed.
Show Results
in Context
Right-clicking on highlighted
program within the Results Window will access the sub-menu similar to the
program sub-menu with additional option at bottom of menu, The feature is only
available from Data Search results. If you group Data Search results by
Program, then the RMB menu on the Program Node is extended with a "Show
Code in Context" option. The new option will open a new Tab showing the
Procedure Division of the Program marked up with the Statements appearing in
the Results. Code which is not marked up can be "folded" to hide it -
as individual sections, or globally. There is a toolbar at the top of the Code
window allowing navigation back & forward through the highlights, plus
toggling the outlining user Highlight.
Right-clicking on any blue
coding element within the Details Window will access the Element Sub Menu options.
Problem: When scoping a change it is often
important to know exactly (& only) where a field is directly used. It may
be initialised and passed around as part of a linkage, file or database record,
but scoping a change will depend upon knowing those statements which directly
manipulate it.
This is very
hard, time-consuming & error-prone using text search – even with CM
evolveIT’s multi-line capability. With these extensions, this becomes simple
1. Search for the field using ‘Match only’ & ‘Direct’
2. Sort the results thus
The default view will then show
That is, out of over 460 Programs
originally scanned, only these 10 contain statements that directly access a
matching field
3. These results may now be exported
9.3 Section 9 - Knowledge Exercises
(1). Conduct a few text searches, exercising the
options in the Text Search side bar.
View the search results.
(2). Open a Data Division
code view on an inventory Application Program of your choosing. Select a data item defined in the Data
Division of the program.
Highlight/select the data item in the code view by right-clicking and
dragging the pointer across the item and copy it by using CNTL-C. Using CNTL-V to paste the selected item name;
set up and execute a Data Search on the selected data item, using various Data
Search sidebar options to set up your search.
Review the search results using various combinations of the Search
Results List, Show and Sort options.
Expand all search result nodes fully and review each result in the
Details Window, exploring blue Coding Element sub menu options for each
result. Do this on 2-3 data items you
find in Application Programs.
10. Documentation - CM evolveIT Diagram Editor
Learning Objectives:
Upon completion of
section 10, students should:
·
have
a general knowledge of the CM evolveIT documentation tab & snapshot
functionality
·
know
the difference between saving & exporting diagrams
·
know
how to edit diagrams in the CM evolveIT snapshot facility
10.1
CM evolveIT Documentation
CM evolveIT provides the user with a resource to manipulate
current diagrams to reflect proposed processing updates through the snapshot
functionality.
Any
diagram created in CM evolveIT can be created\saving\editing for further
documentation. Sidebar that displays
when a diagram is created makes this easy. The documentation can be saved in a
"Personal Documentation Repository"
directory on local disk or a
"Shared Documentation Repository"
directory on Shared network disk
so anyone with the CM evolveIT client on their desktop can open the
documentation. These
diagrams can be shared with other CM evolveIT users through the Documentation
tab within Inventory Viewer. The
diagrams may also be exported &/or printed for use outside of CM evolveIT.
- Capturing a diagram using Snapshot.
After
creating any diagram, the sidebar in the current diagram is displayed:
To
move the diagram to CM evolveIT diagram editor click on the Snapshot button on sidebar.
10.1.1 Saving
This will bring
up the “Save Diagram” window. This is the point where you can save the diagram
to a local drive or a network shared drive.
Saved Diagrams are
re-opened from the "Documentation" panel (bottom sidebar button).
- To
open a Diagram saved elsewhere, select "Browse" to navigate to the
diagram.
- To
open a new, blank page to create a new Diagram, select "New".
10.1.2
Editing
CM evolveIT
diagrams can be edited to include updates that are not yet reflected in the
source contained within the current inventory.
- Right click on shape from shapes
panel to edit text; select ‘apply to selection’.
- Edit Color
by selecting object
- In node
properties box in the left sidebar, click on Style, click on Fill, click on
drop down arrow; navigate to & select new color.
§ Edit text by selecting object,
§ In labels properties box in the left
sidebar, change text under Label, Text.
§ Can also use the Edit tab in the tool bar to change the text of the label. Must click ‘apply’ & ‘ok’ after changes are made.
§ Creating Elements (Nodes, Vertices)
§ Drag an element from the palette onto the canvas or click at an empty location on the canvas.
§ Creating Connections (Edges, Links)
§ Drag a connection from the palette onto an element (node)
on the canvas or drag the mouse with the left button held down on a node.
§ Complete the creation by clicking on a target node.
§ Abort the creation by pressing the Esc key.
§ Create control points (bends) during edge creation by
clicking on an empty area of the canvas, remove the last control point with
Right-click.
§ Creating and Editing Labels
§ Press the F2 key while an element or connection is
selected or add/edit a label in the properties panel while its corresponding
element/connection is selected.
§ The label is not visible nor is it editable until an editable element is ‘applied to selection‘.
§ Simplified Property Editing
- Checkbox
option "Simplified Properties" appears on "Edit"
menu, checked by default
- When
using Simplified Properties the entries in the Options Editor (bottom LH
pane) a reduced set of editable Properties are displayed.
- Note
that enumerated value names in drop down options menus cannot be
changed. Where the meaning of these is not obvious, icons have been
added for clarity.
- Where
possible more meaningful names for Properties in the Options editor
have been introduced.
- If
the check state is changed then a full list of editable Properties
appears for the next selected item (click on the current
selection to refresh.
- The
Options Editor pane and the RMB menu "Properties" on
Nodes/Edges/Labels respect the "Simplified Properties"
selection. Irrespective of the
check state a full editable Properties dialog can be obtained from
Edit->Properties on the Menu Bar.How do you change text in a box from the original group?-The original "CM evolveIT" nodes are not editable, other than to move them.-To modify the text, color, or shape, select the node (or nodes) you want to change, RMB on a Style in the palette, & choose "Apply to selection".*The selected node(s) will take on the new shape, color & style & the text in the box will become the new shape's "label" which can then be edited:*If the node is unselected then RMB over the node & choose "Edit Label";*If the node is selected modify the text in 'Label/Text' on the Properties Panel (RMB 'Properties', F6, or use the Properties Window if visible).*Note that on editable styles the "Label" is a separate object & can be styled individually. For example try changing the 'Label/Label Position' property.-It is possible to modify the text of a Node by editing its Label in the "structure view" on the far right of the window: click the Label twice (not double-click) to rename, just as you would a file in Windows Explorer.*It is not possible to edit the Label of an CM evolveIT original Node - Label editing is disabled for them (click twice will have no effect).-When you select a node in the Structure View it centers the visible canvas on the corresponding Node, as well as selecting it (makes for an easy way to 'search' for a specific node). Changing the Label of a Node will also center the canvas on the modified Node.-Press the LMB over any unselected node & drag (with the mouse button held down) on any unselected node it immediately starts to draw a connection of the currently highlighted style.-ESC aborts the operation, or else dropping (releasing the mouse) over any other node completes the link; release the mouse button over blank space, press again & continue dragging to create a "corner" in the line.-If you accidentally create an edge, CTRL-Z removes it.-Drag & drop of an arrow style from the palette immediately creates a new node of the highlighted style & enters "edge drawing" node as if you had dragged on the new node.
10.1.3 Annotating
Notes are a useful way to add information about the node, edge, &/or diagram in general.
§ Notes can be added to the snapshot diagram.
§ Add to window below diagram; click save button.
- If
the check state is changed then a full list of editable Properties
appears for the next selected item (click on the current
selection to refresh.
-Notes are visible by hovering over
the object to which the notes are applied.
§ Notes are visible in the window below
the diagram when the node or edge is selected.
Below are other editing features available in CM evolveIT
Diagram Editor.
§ Panning and Zooming
o
Move the
diagram view by moving the mouse while Ctrl is pressed.
o
The zoom
factor is changed with the mouse wheel or the zoom buttons in the toolbar.
o
Use
Ctrl-mousewheel to zoom in or out on the center of the displayed area.Display
the entire diagram using the 'Fit Contents' button in the tool bar.
§ Undo/Redo
o
The last
edit operations can be undone by pressing Ctrl+Z, clicking the undo button in the
toolbar or selecting 'Undo' from the 'Edit' menu. Undone operations can be
restored by pressing Ctrl+Y, the redo button or selecting 'Edit/Redo' from the
menu.
§ Grouping
o
Selected
nodes can be grouped into a group node by pressing Ctrl+G. The group node's
size will be adjusted to its contents. Pressing Ctrl+G when no node is selected
creates an empty group node. A node can be added to a group node or removed
from a group node by dragging it with the Shift key held down. The group which
will be the nodes parent is indicated by highlighted corners.
o
Deleting a
group node will remove the group node but not its children.
§ Collapsing and Expanding Groups
o
Collapse a
selected and expanded group node by pressing Ctrl+Minus. Collapse is also
available in the 'Grouping' menu. Collapse a unselected and expanded group node
by by clicking the Minus button in the top left corner of the node.
o
Expand a
selected and collapsed group node by pressing Ctrl+Plus. Expand is also
available in the 'Grouping' menu. Expand a unselected and collapsed group node
by by clicking the Plus button in the top left corner of the node.
§ Entering and Exiting Groups
o
Enter a
selected group node by pressing Ctrl+Enter. Enter is also available in the
'Grouping' menu.
o
Exit a
group node by pressing Ctrl+Backspace. Exit is also available in the 'Grouping'
menu.
§ Automatic Layout
o The graph elements can be arranged automatically by selecting a layout style from the 'Layout' menu. Once a layout style is selected, it can be applied again by clicking the 'Apply' button.
10.1.4
Exporting
§ Exports the viewable screen.
§ Fit to page first or use ‘whole content’ from the advanced options.
§ Use EMF for Visio usage.
§ Advanced options
|
Cell Type |
Available Attributes |
|
|
Application Program |
|
|
|
Copybook |
|
|
|
Database |
|
|
|
Dynamic Calls |
|
|
|
External Files |
|
|
|
Group |
|
|
|
Job |
|
|
|
Job Procedure |
|
|
|
MapSet |
|
|
|
Physical File |
|
|
|
Program Entrypoint |
|
|
|
Schema |
|
|
|
Screen |
|
|
|
System Program |
|
|
|
Table |
|
|
|
Transaction |
|
|
|
Attributes |
Description |
|
Option to select no
attributes. |
|
|
The program has unreachable
code. |
|
|
The name of this item is a variable
name containing the real name. |
|
|
This asset hasn't been
discovered by CM evolveIT |
|
|
Program is contained in a
copybook |
|
|
Program not in inventory |
|
|
Program not in inventory |
|
|
Missing due to missing
program |
|
|
Missing due to missing
program |
|
|
Unsure of what asset it is |
|
|
Transaction Protocol
Monitor |
|
|
Unreachable by fall-through
or direct perform call. |
|
Relation Name |
Description |
|
Called Entrypoint |
Selected Item calls the Highlighted Entrypoint |
|
Called Program |
Selected Item is called by the Highlighted Program |
|
Calling Entrypoint |
Selected Item calls the Highlighted Entrypoint |
|
Calling Program |
Selected Item is called by the Highlighted Program |
|
Calls Calling |
Select Item calls and is called by the Highlighted
Item |
|
Read/Read by |
Selected Item reads or is read by the Highlighted
Item |
|
Uncategorised |
A relationship that does not have a specified category |
|
Update/Updated By |
Selected Item updates or is updated by the
Highlighted Item |
|
Write/Written by |
Selected Item writes or is written by the
Highlighted Item |
Appendix C – CM evolveIT
Asset Sub Menu Options other assets
Assets available
|
Asset Type |
Available operations |
|
NO DATA |
|
|
None |
|
|
NO DATA |
|
COBOL Elements
|
Elements |
Available Operations |
|
Procedural Elements |
|
|
Sections |
Process Datastore Usage Summary |
|
Paragraphs |
Process Datastore Usage Summary |
|
Data Elements |
|
|
Cobol fields and records |
|
|
DB2 Tables |
|
|
DB2 Columns |
|
|
File descriptors |
IndexingOff
Appendix E – Regular Expression Syntax
· CM evolveIT Regular Expression Searches contain a “source text string” & a “Regular Expression pattern”
o In text search – source text string is equal to a full LINE of text.
o In Data search/trace – the source string is an Cobol NAME
§ All searches in Data Search should be for a Cobol Name pattern.
· The search begins by taking the first “character” of the Regex pattern, & looks to match it in the source string
o Ascii characters match themselves normally CASE SENSITIVE
o ^ matches the start of the source string
o $ matches the end of the string
o “meta characters” - ^,$,[,],(,), ... are matched with \ : \$
· Examples of Regex patterns
o ‘.’ Matches ANYTHING
o ‘^...... ‘ force a match to occur in a non-comment COBOL line
o ‘^......[ \-]’ matches on continuation lines as well
§ ‘[‘ introduces a character class – match any of these characters
· [A-Z][A-Z0-9\-]* - COBOL identifier
o * means zero or more of what I just matched
o + means one or more
· ‘^...... +’ starts a match at the first non-space character on a COBOL line
· ‘^...... +MOVE ‘
· ‘^.{6} +MOVE ‘
· ‘.{0,1}’ optional any single character
· \s any whitespace (space or tab), \t is tab
· * & + are greedy
· ^...... +.+\. Matches up the LAST period
· ^...... +.?+\. Matches up to the FIRST period
· ^...... +(.+)\.
· ^...... +([A-Z][A-Z0-9\-]* +)+\.
o Non comment line starting with one or more Cobol identifiers separated by spaces end with a dot (must have spaces before the period)
· OR patterns together with ‘|’
Regular expressions for use for searching Cobol Programs
· Find all “IF” and “EVALUATE” (WHEN Clause) of a specific field (limit the search result to decision tests of a specific field. (Use multi-line setting to find the field where there is a list of “OR”ed fields in the IF statement.
(IF\s+CONV-TRAN-CODE\s+=\s+DATA-LIC-CHANGE)|(WHEN\s+DATA-LIC-CHANGE)
· Find all comments
^......*
· Find a Cobol Field
^......\s[\D]*FIELD-NAME
: (only after 7 characters where the 7th character is whitespace (no comments) followed by anything but numbers (not a data definition))
· Find where a Cobol Field is moved to any field
^......\s+MOVE +FIELD-NAME
:(only after 7 characters where the 7th character is whitespace (no comments) )
· Find where any Cobol Field is moved to a specific field
^......\s+MOVE +[A-Z][A-Z0-9\-]* +to +FIELD-NAME
:(only after 7 characters where the 7th character is whitespace (no comments) )
· Find any 3 character literal (hard code)
^......\s+.*’…’
:(only after 7 characters where the 7th character is whitespace (no comments) )
· Find where any 3 character literal (hard code) is moved to a specific field
^......\s+MOVE +’…’ +to +FIELD-NAME
:(only after 7 characters where the 7th character is whitespace (no comments) )
|
Character |
Description |
Example |
|
Any character except [\^$.|?*+() |
All characters except the listed special characters match a single instance of themselves. { and } are literal characters, unless they're part of a valid regular expression token (e.g. the {n} quantifier). |
a matches a |
|
\ (backslash) followed by any of [\^$.|?*+(){} |
A backslash escapes special characters to suppress their special meaning. |
\+ matches + |
|
\Q...\E |
Matches the characters between \Q and \E literally, suppressing the meaning of special characters. |
\Q+-*/\E matches +-*/ |
|
\xFF where FF are 2 hexadecimal digits |
Matches the character with the specified ASCII/ANSI value, which depends on the code page used. Can be used in character classes. |
\xA9 matches © when using the Latin-1 code page. |
|
\n, \r and \t |
Match an LF character, CR character and a tab character respectively. Can be used in character classes. |
\r\n matches a DOS/Windows CRLF line break. |
|
\a, \e, \f and \v |
Match a bell character (\x07), escape character (\x1B), form feed (\x0C) and vertical tab (\x0B) respectively. Can be used in character classes. |
|
|
\cA through \cZ |
Match an ASCII character Control + A through Control + Z, equivalent to \x01 through \x1A. Can be used in character classes. |
\cM\cJ matches a DOS/Windows CRLF line break. |
|
Character |
Description |
Example |
|
[ (opening square bracket) |
Starts a character class. A character class matches a single character out of all the possibilities offered by the character class. Inside a character class, different rules apply. The rules in this section are only valid inside character classes. The rules outside this section are not valid in character classes, except \n, \r, \t and \xFF |
|
|
Any character except ^-]\ add that character to the possible matches for the character class. |
All characters except the listed special characters. |
[abc] matches a, b or c |
|
\ (backslash) followed by any of ^-]\ |
A backslash escapes special characters to suppress their special meaning. |
[\^\]] matches ^ or ] |
|
- (hyphen) except immediately after the opening [ |
Specifies a range of characters. (Specifies a hyphen if placed immediately after the opening [) |
[a-zA-Z0-9] matches any letter or digit |
|
^ (caret) immediately after the opening [ |
Negates the character class, causing it to match a single character not listed in the character class. (Specifies a caret if placed anywhere except after the opening [) |
[^a-d] matches x (any character except a, b, c or d) |
|
\d, \w and \s |
Shorthand character classes matching digits 0-9, word characters (letters and digits) and whitespace respectively. Can be used inside and outside character classes. |
[\d\s] matches a character that is a digit or whitespace |
|
\D, \W and \S |
Negated versions of the above. Should be used only outside character classes. (Can be used inside, but that is confusing.) |
\D matches a character that is not a digit |
|
[\b] |
Inside a character class, \b is a backspace character. |
[\b\t] matches a backspace or tab character |
|
Character |
Description |
Example |
|
. (dot) |
Matches any single character except line break characters \r and \n. Most regex flavors have an option to make the dot match line break characters too. |
. matches x or (almost) any other character |
|
Character |
Description |
Example |
|
^ (caret) |
Matches at the start of the string the regex pattern is applied to. Matches a position rather than a character. Most regex flavors have an option to make the caret match after line breaks (i.e. at the start of a line in a file) as well. |
^. matches a in abc\ndef. Also matches d in "multi-line" mode. |
|
$ (dollar) |
Matches at the end of the string the regex pattern is applied to. Matches a position rather than a character. Most regex flavors have an option to make the dollar match before line breaks (i.e. at the end of a line in a file) as well. Also matches before the very last line break if the string ends with a line break. |
.$ matches f in abc\ndef. Also matches c in "multi-line" mode. |
|
\A |
Matches at the start of the string the regex pattern is applied to. Matches a position rather than a character. Never matches after line breaks. |
\A. matches a in abc |
|
\Z |
Matches at the end of the string the regex pattern is applied to. Matches a position rather than a character. Never matches before line breaks, except for the very last line break if the string ends with a line break. |
.\Z matches f in abc\ndef |
|
\z |
Matches at the end of the string the regex pattern is applied to. Matches a position rather than a character. Never matches before line breaks. |
.\z matches f in abc\ndef |
|
Character |
Description |
Example |
|
\b |
Matches at the position between a word character (anything matched by \w) and a non-word character (anything matched by [^\w] or \W) as well as at the start and/or end of the string if the first and/or last characters in the string are word characters. |
.\b matches c in abc |
|
\B |
Matches at the position between two word characters (i.e. the position between \w\w) as well as at the position between two non-word characters (i.e. \W\W). |
\B.\B matches b in abc
|
|
Character |
Description |
Example |
|
| (pipe) |
Causes the regex engine to match either the part on the left side, or the part on the right side. Can be strung together into a series of options. |
abc|def|xyz matches abc, def or xyz |
|
| (pipe) |
The pipe has the lowest precedence of all operators. Use grouping to alternate only part of the regular expression. |
abc(def|xyz) matches abcdef or abcxyz |
|
Character |
Description |
Example |
|
? (question mark) |
Makes the preceding item optional. Greedy, so the optional item is included in the match if possible. |
abc? matches ab or abc |
|
?? |
Makes the preceding item optional. Lazy, so the optional item is excluded in the match if possible. This construct is often excluded from documentation because of its limited use. |
abc?? matches ab or abc |
|
* (star) |
Repeats the previous item zero or more times. Greedy, so as many items as possible will be matched before trying permutations with less matches of the preceding item, up to the point where the preceding item is not matched at all. |
".*" matches "def" "ghi" in abc "def" "ghi" jkl |
|
*? (lazy star) |
Repeats the previous item zero or more times. Lazy, so the engine first attempts to skip the previous item, before trying permutations with ever increasing matches of the preceding item. |
".*?" matches "def" in abc "def" "ghi" jkl |
|
+ (plus) |
Repeats the previous item once or more. Greedy, so as many items as possible will be matched before trying permutations with less matches of the preceding item, up to the point where the preceding item is matched only once. |
".+" matches "def" "ghi" in abc "def" "ghi" jkl |
|
+? (lazy plus) |
Repeats the previous item once or more. Lazy, so the engine first matches the previous item only once, before trying permutations with ever increasing matches of the preceding item. |
".+?" matches "def" in abc "def" "ghi" jkl |
|
{n} where n is an integer >= 1 |
Repeats the previous item exactly n times. |
a{3} matches aaa |
|
{n,m} where n >= 1 and m >= n |
Repeats the previous item between n and m times. Greedy, so repeating m times is tried before reducing the repetition to n times. |
a{2,4} matches aa, aaa or aaaa |
|
{n,m}? where n >= 1 and m >= n |
Repeats the previous item between n and m times. Lazy, so repeating n times is tried before increasing the repetition to m times. |
a{2,4}? matches aaaa, aaa or aa |
|
{n,} where n >= 1 |
Repeats the previous item at least n times. Greedy, so as many items as possible will be matched before trying permutations with less matches of the preceding item, up to the point where the preceding item is matched only n times. |
a{2,} matches aaaaa in aaaaa |
|
{n,}? where n >= 1 |
Repeats the previous item between n and m times. Lazy, so the engine first matches the previous item n times, before trying permutations with ever increasing matches of the preceding item. |
a{2,}? matches aa in aaaaa |
IndexingOn
Related Articles
CM evolveIT Administrator Manual
Please look at the attached file(s)User Group
Dashboard - User Group This document will cover the basics of the CM EvolveIT Dashboard user mapping. There will be a discussion of how to create user groups and set user authority within the group. We will look at how to assign inventories to groups ...WebClient Manual
Here you can find the articles of the CM WebClient user manual, just click on the name and it will take you directly to the article. Introduction Installation Requirements Plex Model Configuration Overview of Workspace Setup Calling WebClient from an ...CM evolveIT Dashboard APIs
This document will cover the basics of the CM evolveIT Dashboard Configuration Tool. There will be a discussion about what APIs are available, how to use the APIs and how to test results from the APIs. The last section of the document will walk ...CUD and User Mapping
This document will cover the basics of the CM evolveIT Dashboard user mapping. There will be a discussion of how to create user groups and set user authority within the group. We will look at how to assign inventories to groups as well as how to ...